Showing posts with label Sabermetrics 101. Show all posts

Wednesday, January 26, 2011

2011 Cleveland Indians Lineup by The Book

Last year, Manny Acta made a splash by dropping Grady Sizemore to second in the batting order. This year, he's considering moving him back to leadoff. Is either the right move? And how should the rest of the lineup look?

The Book, one of the best sabermetric books you can find, did extensive work on lineup construction. Their main conclusion was that lineup order didn't matter too much, but it can be optimized for marginal gains. The Book's findings are summarized very well in this Beyond the Boxscore post.

To get the stats for Cleveland's upcoming season, I used the Cairo Projections, which are described (and available for download) here. The nice thing about version 0.5 of this years Cairos is that they include lefty/righty splits. It uses wOBA, which is decribed in detail in the new Frangraphs library. As you can see, wOBA is scaled to be comparable to batting average, with a .321 wOBA being the league average in 2010.

First, here's how the Indians lineup should look against lefties. I took the top nine players in terms of wOBA against lefties, and fortunately things worked out nicely in the field.
ordernameposwOBA
1Shin-Soo ChooRF.343
2Matt LaPorta1B.351
3Shelley DuncanLF.332
4Carlos SantanaC.346
5Austin KearnsCF.342
6Jayson Nix3B.327
7Asdrubal CabreraSS.326
8Travis HafnerDH.326
9Jason Donald2B.325


The glaring omission, of course, is Grady Sizemore. Cairo projects Sizemore to have a wOBA of only .309 against lefties. But if you insist on playing him (both in the name of fan interest, and so Kearns doesn't have to play center), you can remove Hafner from the lineup, DH Duncan, and move Donald up to eighth with Grady batting ninth.

Some other items of note:
  • Everyone in this lineup is projected to hit above a .321 wOBA. That's nice, but .321 was the average in 2010 against all pitchers. The average against lefties in 2011 may be higher or lower.
  • Indians fans should be especially pleased to see such a nice number for Matt LaPorta, especially after his struggles at the plate these past few years.
  • LaPorta and Santana have very similar numbers, but Santana has a slight edge in power, giving him the fourth spot over LaPorta. While Choo also has very good power, his on base percentage is just too good to put anywhere but first.


Now, the lineup against righthanders. Unfortunately I wasn't able to take just the best nine hitters this time. Michael Brantley and Travis Buck both rated ahead of Jack Hannahan. Brantley, Buck, and Duncan all rated ahead of Nix and Donald as well. But somebody has to play second and third base.
ordernameposwOBA
1Shin-Soo ChooRF.390
2Carlos SantanaC.359
3Matt LaPorta1B.332
4Grady SizemoreCF.363
5Travis HafnerDH.342
6Austin KearnsLF.322
7Asdrubal CabreraSS.318
8Jack Hannahan3B.309
9Jayson Nix2B.307


If you don't think Jack Hannahan is going to break camp with the Tribe, feel free to move Nix up a spot in the order and plug Jason Donald's .303 wOBA into the nine hole.

Notes on this lineup:
  • Choo blew everyone away in both on base percentage and slugging. But I chose to hit him leadoff, just to give our best hitter as many at bats as possible.
  • Believe it or not, Sizemore is expected to have better slugging numbers than Santana, and Santana better on base numbers than Sizemore. That's why Grady is hitting fourth and Carlos second.
  • Cabrera, Nix, and Hannahan/Donald will need to be good with the glove to make up for their below-average projections. Other than that, though, this isn't too bad a lineup.


Finally, for those interested, here are the numbers for a few key players who failed to crack either lineup:
namewOBAvs Lvs R
Michael Brantley.310.291.316
Travis Buck.306.288.312
Luis Valbuena.300.286.302
Trevor Crowe.289.283.290
Adam Everett.268.282.264

Monday, January 19, 2009

Sabermetrics 101: Fielding Statistics

Don't worry, there is very little math involved this time.

For many years, sabermetricians ignored fielding, at least partially because it was so much harder to quantify compared to hitting.

The original fielding metric is fielding percentage, (outs + assists)/(outs + assists + errors). That was fine in the 1800s, when it's been argued that players weren't expected to catch anything that wasn't hit right at them. To this day, errors are still subject to the opinion of the official scorer, as witnessed recently by CC Sabathia's lost no hitter on a bunt single and Orlando Cabrera's in-game call to the press box to have an error changed to a hit.

So errors and fielding percentage are probably not the best way to judge a fielder. Then, what is? Arguably, there are two ways to do so: noting whether a fielder got to a ball (or whether they should have), and whether they actually fielded it once they got there. (Throwing ability - accuracy and strength - are another issue, but we won't go into that today.) Brian Cartwright wrote an excellent piece for Fangraphs the other day, explaining why fielders with poor range are better at actually fielding the ball, and vice-versa.

Other Fielding Statistics

As mentioned above, sabermetricians avoided fielding for a long time because it was difficult to quantify. Now, a variety of fielding measures exist, and still we have none that stands head and shoulders above the rest. Here are just a few metrics that exist today.
  • Range Factor: Bill James' first crack at a fielding statistic, Range Factor is the number of plays a fielder makes per nine innings. In other words, it's basically the fielding equivalent of ERA. Of course, like ERA the system has its drawbacks. For example, the type of pitcher (flyball vs. ground ball) will affect the number of chances a fielder has in a game.

  • Zone Rating: STATS Inc. divided the field into zones and calculates Zone Rating as the number of outs made in a fielder's designated zones divided by the total number of balls hit into that zone.

  • John Dewan's Plus/Minus: Like many of these fielding stats, Plus/Minus involves watching video of every single play over the course of a season and charting whether a fielder should have made the play. In this case, Baseball Info Solutions (BIS) assigns a "plus" for every play made that someone else at that position didn't make, and a "minus" for every play not made that someone else at that position made.

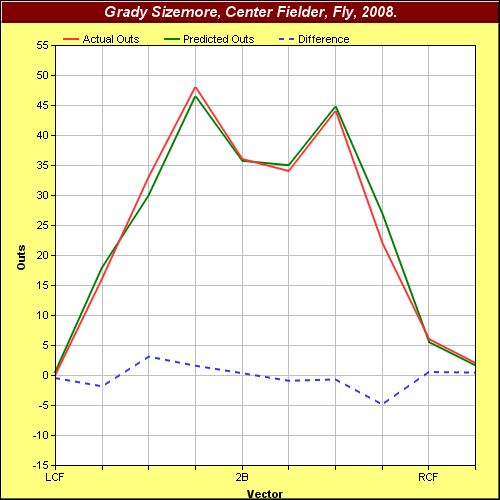
  • Probabilistic Model of Range: Created by Dave Pinto, a former ESPN and STATS, Inc. statistician, PMR is another way of comparing a fielder's performance relative to his peers. PMR views the field as a right angle, and breaks fielding down by angle relative to the foul lines. That information can be used to create graphs like this one, which shows that in 2008, Grady Sizemore was slightly above average (compared to other center fielders) on fly balls hit to his right, but slightly below average on flies to his left.

  • Ultimate Zone Rating: A continuation of Zone Rating, Mitchel Lichtman's UZR is actually calculated two ways: using BIS's data and using STATS Inc.'s data. Here is a comparison of the two UZR ratings and PMR.

  • Fan Scouting Report: For those of you that don't like math at all (except for counting), this is the stat for you. Tangotiger's Fan Scouting Report is a crowdsourced scouting report that ranks fielders in terms of instincts, first step, speed, hands, release, arm strength, and throwing accuracy.

  • : If the Fan Scouting Report is perfect for those who don't like math, than Colin Wyers' graphs are perfoect for those who don't even like words. Colin simply took the location of every fielded ball and plotted it on a graph, with a baseball field laid as the backround. Here's a comparison of Troy Tulowitzki and Derek Jeter's 2007 fielding.


The Next Steps

Fielding statistics still have many unsolved questions, but two of the main issues are determining a fielder's starting position, and determining teammates' influence on fielding statistics.

The comments of this thread have a discussion of fielders' starting position. As the charting and video coverage of games improve (PitchF/X, HitF/X, and the work BIS and STATS do), this area will improve as well. Of course, starting position needs to be taken in context. If a fielder is always standing in the right place at the right time, they certainly should get credit for knowing where to stand (or at least his coaches should get credit). But standing in the right place means he won't have as far to run to get to a ball, and therefore it will seem as if he doesn't have much range. So statisticians will have to be careful not to punish him for that.

Another issue is the affect teammates have on each other. For example, on a ball hit between the first and second baseman, the first baseman has the first attempt at the ball because he's positioned closer to first base. A second baseman would only have a chance at the ball if the first baseman couldn't get to it.

Take a look at the PMR ground ball charts for Ryan Howard, Chase Utley, Albert Pujols, and Aaron Miles. At first it looks like Miles is below average at ground balls towards first base. But perhaps that is because Pujols is getting to many of the balls that normally would have gone through to his second baseman. Likewise, Chase Utley appears to be great at getting ground balls towards first base, but only because Ryan Howard is below average at fielding balls in that direction. Trade Utley for Miles (a move the Phillies surely would never make), and you would probably see Utley's PMR decline and Miles' improve.

Of course, PMR also does not indicate starting position. Knowing that Howard isn't a great fielder, maybe Utley positions himself a little closer to first base to make up for it. And maybe Miles positions himself a little farther from second base to account for Pujols' range. But if that was the case, you would expect Utley to have below-average performance on balls hit towards second base, and Miles to have above-average performance. In reality, the graphs show that Utley is above average in both directions, while Miles is only average on balls hit towards second base. So, Utley had a phenomenal 2008 in the field, a fact corroborated by his unheard of +47 rating in John Dewan's Plus/Minus system.

The Jhonny Peralta Problem

One of the big questions for Cleveland Indians fans is Jhonny Peralta's defense. Most fans want him to move to third base, but in the past I have suggested a move to second base.

How does Peralta rate as a shortstop? According to PMR (2006, 2007, 2008), he's actually around average on grounders, and maybe even a little above average on fly balls and liners. But UZR gives him a negative rating for every year after his rookie season.

Working on the assumption that he's a below-average shortstop (even if that disagrees with PMR), where should he move? As per this discussion, shortstop is the most difficult position on the field besides catcher. So a move anywhere would improve Peralta's defense, in theory. In his limited time at third, Peralta has been at least average according to PMR and UZR.

There is no data on Peralta at second because he hasn't played there, but there is the Fan Scouting Report. Peralta's 2008 report says he has excellent arm strength, very good throwing accuracy, and almost average hands and release (with 50 being average in all categories). He also has poor ratings in instincts, first step, and speed. First step and speed are more important to a second baseman than arm strength and quick release, so we can probably rule out moving Peralta there. The combination of arm strength, accuracy, hands, and release are exactly what to look for in a third baseman. Instincts would arguably be nice as well, but the hot corner is as much about reaction as it is about instinct.

Wednesday, January 07, 2009

Cleveland Indians WAR Spreadsheet

Thanks to the hard-working Sky Kalkman over at Beyond the Boxscore, here's a spreadsheet of the Indians 2009 predicted Wins Above Replacement (WAR).


Some notes:
  • For hitting and pitching, I used the CHONE projections. On Sky's suggestion, I also used the quick-and-dirty formula (OBP*1.75 + SLG)/3 to approximate wOBA.

  • I included Luis Valbuena on offense to get closer to the "recommended" number of outs. As you can see, I'm still short. I'm not doing this as an endorsement of Valbuena over Barfield; CHONE has nearly identical plate appearances and wOBA for the two, making them interchangeable for the purposes of this exercise. I did leave out Andy Marte, since the popular assumption is that his time in Cleveland is short.

  • While my spreadsheet falls short of the recommended outs on offense, adding players (and therefore outs) actually increases offensive WAR in most cases. So, take this as a low-end projection.

  • Baserunning numbers are from Baseball Prospectus's EqBRR. I just used the 2008 numbers, so obviously there's room for improvement there.

  • For fielding, I used UZR from Fangraphs. I took a straight average of each player's UZR from 2006-2008 (when available). Obviously, a weighted average probably would have been better.

  • I also ignored position when taking UZR. This is mostly because I'm convinced the Indians will try some experimenting on the infield to get it right. But at the same time, I didn't want to guess how many innings each player would log at each position.

  • For the rotation, I started with the four known quantities - Lee, Carmona, Pavano (who will hopefully top that inning projection), and Reyes. Then I started filling in the best available players based on the CHONES until I got to the recommended inning count.

  • For the relievers, I followed the current Indians.com depth chart until I got to the recommended number of innings. But that doesn't necessarily mean I endorse that depth chart.


What does this all mean? If I filled in the spreadsheet correctly, the Indians project to a 90 win team. That's right on the cusp of the playoffs, which is exactly where the Indians want to be.

Wednesday, December 10, 2008

Cleveland Indians Sabermetrics 101: DIPS and RAR

In the last installment, we discovered that all pitchers' BABIP tend to fall in the .290 to .310. It follows then that if we want to gauge a pitcher's talent level, we need to look at everything besides balls hit into play. "Everything else" consists of strikeouts, walks, and homeruns, generally considered the "three true outcomes." There are a number of stats that study the three true outcomes, and together they are referred to as defense-independent pitching statistics - DIPS.

Before I go into examples of DIPS, I need to define a few terms.

replacement level: This is a popular concept among statheads. A replacement level player is one that is easily available as a mid-season free agent signing or a AAA call-up. Indians fans saw many replacement level players make starts for the Indians last year, Matt Ginter for example.

Runs Above Replacement, RAR: If "replacement level" is the amount of production you can get out of a player off the scrap heap, you would expect your regular players to be able to perform above that level. For pitchers, this means comparing the number of runs a pitcher gave up over a certain number of innings and comparing it to the number of runs a replacement player would have given up over the same number of innings. This is a tally of runs "saved" compared to a replacement pitcher, so a high positive number is better.

RAR for pitchers is calculated by taking the replacement level ERA, which is generally taken to be 5.75, subtracting the player's ERA, diving by 9 (since ERA is a measure of runs given up per 9 innings), and multiplied by innings pitched:

(5.75 - ERA) / 9 * IP

Wins Above Replacement, WAR: It's generally accepted in sabermetric circles that 10 runs is equal to 1 win. So, to find out how many Wins Above Replacement a pitcher earned, their RAR is divided by 10.

DIPS

Beyond the Box Score's article on this topic covers many pitcher stats. I'll let you look through those at your own leisure. The most advanced is a new stat called tERA. It takes the three true outcomes mentioned above, plus HBP and percentage of hits that were ground balls, line drives, infield flies, and outfield flies, plus takes the ballpark into factor. With input that complicated, it has to be accurate, right? Well, you and I can just take their word for it for the time being.

Since the goal for many sabermetricians is to take luck out of the equation, StatCorner - the same people that created tERA - also created xIP, expected Innings Pitched. Put simply, xIP tries to determine what each play "should have been" (ie, a screaming liner that was caught is changed to a hit, and a blooper that dropped is changed to an out) to give a more accurate look at the pitcher's workload.

Indians RAR/WAR in 2008

How did the Indians fare in 2008?
PitcherxIPtERARARWAR
Cliff Lee2222.64778
CC Sabathia122.673.26343
Fausto Carmona1214.64151
Zach Jackson573.81121
Aaron Laffey92.674.77101
Paul Byrd1285.4050
Jake Westbrook334.4050
Matt Ginter21.333.7650
Anthony Reyes324.7440
Scott Lewis234.5230
Jeremy Sowers1185.89-20
Bryan Bullington9.677.49-20
Tom Mastny1.6723.83-30
Total Result98279.13162.4516.24

As you can see, by this methodology Cliff Lee won eight games all by himself. Meanwhile, Matt Ginter, Bryan Bullington, and Tom Mastny were almost the definition of replacement level.

But that 162.45 total RAR means nothing without context. Cleveland finished fifth in the AL in RAR in 2008, just behind Boston and Tampa Bay, and just ahead of Anaheim and Minnesota. Toronto and the White Sox were almost 50 points ahead of their closest competitors, thanks to aces (Roy Halladay and Mark Buehrle) that scored in the 70s with a solid supporting staff. (Halladay and AJ Burnett are worth stars, but the rest of the Toronto rotation is very underrated.

Indians RAR/WAR in 2009

So, how do the Indians look in 2009? Will they need to add another starter?

The calculations for tERA and xIP are beyond my abilities at this point, so I cheated and used the innings pitched and ERA predictions from the 2009 Marcels. Here's what Marcel have to say for the guys currently on the 40 man roster.
PitcherIPERARARWAR
Cliff Lee1803.80394
Fausto Carmona1354.13242
Zach Jackson834.7291
Aaron Laffey1124.26192
Jake Westbrook934.16162
Anthony Reyes844.45121
Scott Lewis724.00141
Jeremy Sowers1274.82131
Total Result88634.34147.0314.7

Uh oh. That 147.03 RAR would be, by 2008 standards, ninth best in the AL. But there are a few things to remember. Marcel is admittedly a "dumb" system, and it looks at three years of data. That means it's taking Cliff Lee's disappointing 2007 and Fausto Carmona's nightmare 2006 into account. Also, RAR is dependent on innings pitched. So, once the Indians settle on their five best starters, and give them the innings that went to "experiments" last year, the numbers should improve.

Wednesday, December 03, 2008

Cleveland Indians Sabermetrics 101: BABIP

Inspired by this post at Beyond the Boxscore, here's my first "homework assignment" for Saber-Friendly Blogging 101.

Batting Average on Balls In Play, BABIP, is essentially batting average for everything except strikeouts and walks. I'll let the article above, Wikipedia, and the Sabermetric Wiki give you the details.

BABIP for hitters relies on many factors and will vary from player to player. But for pitchers, BABIP always seems to fall in the .290 to .310 range. What does this mean? If a pitcher is widely outside of that range one year, you can expect them to regress back to those numbers the following year, and their overall performance should follow. (I'm sure there are cases of certain pitchers having consistently high or low BABIP numbers, but I don't know of any offhand.)

So, how did Indians pitchers fare in 2008? To find out, you can check The Hardball Times or Fangraphs. Or, if you'd rather do the work yourself (or, like me, didn't find out about the THT and Fangraphs page until after doing the work), you need to start with their 2008 stats.

If you're not up to the task of setting up a MySQL database of baseball stats, you can simply copy and paste them from Baseball-Reference's 2008 Indians page into Excel. To determine At Bats, I took BFP (Batters Faced by Pitcher) minus Bases on Balls and Hit By Pitch. (I assumed IBB totals were already included in IBB.) I also ignored Sacrifice Flies because that information wasn't readily available. My results were almost identical to those from the Hardball Times. Fangraphs' were a little different, but as the Sabermetric Wiki mentions, there are several variations to the formula.

PlayerABBABIP ERA
Rich Rundles19.3851.80
Tom Mastny89.34410.80
Edward Mujica157.3286.75
Rafael Betancourt284.3115.07
Zach Jackson221.3105.60
Masahide Kobayashi229.3064.53
Rafael Perez288.3043.54
Cliff Lee852.3012.54
Jeremy Sowers491.3015.58
Jensen Lewis260.3003.82
Aaron Laffey369.2944.23
Fausto Carmona470.2945.44
Jake Westbrook131.2623.12
Anthony Reyes129.2591.83
Scott Lewis91.2222.63
Jonathan Meloan5.0000.00


I included At Bats in this table to illustrate a point: in general, as at bats increased, the pitcher's numbers moved more to the .290-.310 range. Rich Rundles and Jon Meloan only faced a handful of batters, so their numbers can largely be ignored. But you could almost argue the same for Scott Lewis and Tom Mastny.

Now, this table is good news for Tom Mastny and Ed Mujica, and even Rafael Betancourt and Zach Jackson to some extent. All posted high ERA and high BABIP. But their BABIP should go down in 2009, and their other stats should improve as a result. Conversely, Anthony Reyes and Scott Lewis will probably see their spectacular 2008 numbers fall back to earth. Jake Westbrook will probably see a decline as well, once he's finally healthy.

If BABIP holds true, that middle group should stay about the same. That's great news for Cliff Lee, Rafael Perez, and Jensen Lewis, as well as Aaron Laffey and Masahide Kobayashi to some extent. But it's also bad news for Jeremy Sowers and Fausto Carmona.

But BABIP is by no means a be-all, end-all predictor. For example, while Rafael Betancourt was on the edge of the expected BABIP range, his ERA was abnormally high (for him) due to a lingering injury that kept him from throwing his fastball, which is his best pitch. And while Cliff Lee was right in the middle in terms of BABIP, he'll still be hard-pressed to repeat the phenomenal year he had in 2008. Still, his BABIP numbers do show that 2008 wasn't entirely luck, and that Lee should still do very well in 2009.