Showing posts with label Cleveland Indians. Show all posts

Wednesday, August 03, 2011

Trade Deadline Thoughts

Indians

Acquired Kosuke Fukudome from the Cubs for Abner Abreu and Carlton Smith

The Indians do need outfielders while Grady Sizemore and Shin-Soo Choo are out. While Fukudome isn't the power right handed bat they were hoping for, he is a serviceable veteran starter with a high on base percentage. His tendency to fade down the stretch is a concern, but Sizemore and Choo will be back relatively soon, and hopefully before that fading does any serious damage.

On top of that, the Indians didn't give up much in return. Smith is a AAA reliever, which the Indians have plenty of. Abreu is having a good season, but he's also playing high A ball the second time around this year.

Traded Orlando Cabrera to the Giants for Thomas Neal

Neal also isn't the power-hitting right-handed outfielder the Indians were hoping for, but he's a decent return for Orlando Cabrera. With tons of depth at second base in the majors and AAA, the Indians could afford to get rid of Uncle Orlando. Jason Kipnis's home runs in three straight games since the trade has helped as well.

The Giants, meanwhile, continue their role as a final resting place for former All Star middle infielders.

Didn't acquire Ryan Ludwick

As mentioned above, the Indians were looking for a right-handed hitting outfielder. Ludwick and his 90 OPS+ (which does take Petco Park into account) isn't the answer, and when the Padres raised his price, the Indians were wise to let him go.

Acquired Ubaldo Jimenez from the Rockies for Joe Gardner, Alex White, Matt McBride and a player to be named later (Drew Pomeranz)

Yes it's a gutsy move, but it's a good one. Jimenez is only signed through 2013, but so are all the other Indians stars. As much as I don't like the model of competing only once every five years, at least the Indians are committed to it, and this trade proved it. Playoff success is built with two ace pitchers, and the Indians may have them now in Jimenez and Justin Masterson.

Of course, Jimenez didn't come cheap. White is already major league ready (as evidenced by his 3.60 ERA in a handful of start), and Pomeranz is expected to be better. But both are injury risks at a certain level. Gardner and McBride are essentially throw-ins; the latter is a great hitter at AA but hasn't proved much above that level.

So again, although the Indians gave up quite a bit in the trade, I like it because it shows they're going all in for the next two and a half years.

Pirates

Acquired Ryan Ludwick from the Padres for a player to be named later
Acquired Derrek Lee from the Orioles for Aaron Baker


Both acquisitions show an aggressive Pittsburgh front office, which is just what Pirates fans want to see right now. Lee may only be a league-average hitter at this point, but that's still an improvement over what the Pirates had been getting at first base.

Mets

Traded Francisco Rodriguez to the Brewers for two players to be named later

Closers, good or bad, aren't needed much on rebuilding teams, so they're always a good piece to trade away.

Acquired Zack Wheeler from the Giants for Carlos Beltran

Beltran was perhaps a bit underappreciated during his time in New York, but Mets fans were still sad to see him go. Beltran will add some pop to a lifeless Giants offense and move to right field, where his range will be a benefit in San Francisco's home park.

Wheeler is a great return for half a year of Beltran. The pitching prospect does have control issues, but he also comes with tons of upside.

Rangers

Acquired Mike Adams from the Padres for prospects Joe Wieland and Robbie Erlin

When I first heard about this trade, the announcer erroneously reported that the Rangers acquired Heath Bell, not Mike Adams. While I have nothing against Bell, Adams may in fact be the better pitcher. This move obviously gives the Rangers great bullpen depth. Plus, if they can re-sign him again next year, they have the option of moving him to closer and making Neftali Feliz a starter, if they so choose.

Blue Jays

Acquired Edwin Jackson and Mark Teahen from the White Sox for Jason Frasor and Zach Stewart
Acquired Colby Rasmus, Trever Miller, Brian Tallet, and PJ Walters from the Cardinals for Edwin Jackson, Marc, Rzepczynski, Octavio Dotel, and Corey Patterson


Teahen, Jose Bautista, and Edwin Encarnacion are all 3B/RF/DH types. Bautista is obviously a star. Teahen isn't, but he's a definite step up from Encarnacion.

The unenlightened Blue Jays fan may think Colby Rasmus is another underachieving center fielder in the mold of Vernon Wells or Alex Rios, but in fact Rasmus is a burgeoning star. In a way it's funny that Rasmus, highly underrated by the casual fan, was traded for Edwin Jackson, who's somewhat overrated by the casual fan.

Also, Brian Tallet is awesome.

Red Sox

Acquired Erik Bedard and Josh Fields from Seattle as part of a three-way trade

Bedard is having a great comeback year, and Boston starters are having trouble staying off the DL. If Bedard can hold off that DL curse, this will be a great pickup for the Sox.

Diamondbacks

Acquired Jason Marquis from the Nationals

Playoffs, here they come!

Astros

Acquired Jordan Schafer, Brett Oberholtzer, Paul Clemens, and Juan Abreu from the Braves for Michael Bourn
Acquired Jarred Cosart, Jonathan Singleton, and Josh Zeid from the Phillies for Hunter Pence


The Astros were wise to at least try rebuilding for once. I think they were helped by the down year for available position players as well. Schafer and Cosart are the headliners in this deal, and Schafer will step into the starting outfield right away.

Cardinals

Acquired Rafael Furcal from the Dodgers for Alex Castellanos
Acquired Edwin Jackson, Marc Rzepczynski, Octavio Dotel, and Corey Patterson from the Blue Jays for Colby Rasmus, Trever Miller, and Brian Tallet


Tony LaRussa's personal grudges may finally be catching up for him. The Furcal deal is to make up for trying to replace Brendan Ryan with Ronnie Theriot, and replacing Rasmus with Patterson doesn't look like a good move even with the other names thrown in that deal.

Reds

Traded Jonny Gomes to the Nationals for Bill Rhinehart and Chris Manno

Does this mean my "Jonny Gnomes" gnome is even more of a collector's item now?

Marlins

Acquired Mike Cameron for a player to be named later or cash

Cameron was underappreciated in Boston, as he was everywhere he's been. That said, I fail to see how this move benefits the Marlins at this stage, unless it's too take some pressure off of Logan Morrison and Mike Stanton in the lineup and in the outfield.

Wednesday, February 02, 2011

SABR Day in Cleveland: Mike Chernoff's Comments on the Indians

This past Saturday was SABR Day, and Cleveland's Jack Graney Chapter celebrated with a meeting in the press room of Progressive Field. One of the star guest speakers was Mike Chernoff, the new Indians Assistant General Manager. Chernoff is a 2003 Princeton graduate, where he studied economics and played baseball.

Chernoff's dad was in the back of the room; father and son have played a game of catch monthly for as long as the two remember. The elder Chernoff works in the Mets radio team, and the younger's career began as an intern with that very same team. Since then, Mike has worked his way up from Indians intern to Indians AGM. Here are his thoughts on this year's team.
  • The front office expects to contend and suprise ahead of schedule, like it did in 2003 and 2004.

  • Carlos Santana will start season, and in fact should be ready ready at start of spring training.

  • Chernoff compared Matt LaPorta to the Cliff Lee of 2007-2008 - a player struggling with injuries and inconsistencies who spent some time in the minors and was poised for a breakout.

  • Because of all the time Asdrubal Cabrera lost to injury last year, his return is like a "new acquisition" for the team.

  • Other teams call all the time for Michael Brantley as their CF.

  • Shin-Soo Choo is an elite RF, but "don't tell his agent I said that."

  • Austin Kearns was re-signed as insurance in case Grady Sizemore can't play every day at the start of the season. (Kearns would play left field with Brantley moving to center.

  • Jason Donald and Jayson Nix are in the mix at third, with Luis Valbuena at second.

  • Second and third base are the biggest holes right now, but also the biggest positions of strength in the future.

  • It would be unrealistic to start Lonnie Chisenhall in the majors without more time in AAA, but Chis may prove the team wrong in spring training.

  • Understandably, the team gets a lot of calls about Chisenhall.

  • Cord Phelps is ahead of Jason Kipnis right now, but both have similar star power.

  • The second half of the season was much better than the first for the Indians, especially the pitching.

  • Fausto Carmona, Justin Masterson, Mitch Talbot, and Carlos Carrasco are set in the rotation. The fifth spot will go to one of the guys from last year, or a free agent.

  • The Indians have 10-12 available bullpen arms who are young but good.

  • The front office, who has struggled putting together an effective bullpen in the past, has determined that they need to get tons of guys with flexibility (options), so they can swap parts in and out as needed.

  • Bryce Stowell, Josh Judy, and Zach Putnam are all candidates for a bullpen spot.

  • Travis Hafner is still productive, but not a "seven day" (everyday) player. He's most effective against righthanders, so hopefully playing Pronk against righties and Kearns/Shelley Duncan against lefties will give the combined production of a top five DH.

  • Mike Hargrove will have a variety of roles with the Tribe, on the field and off. For example, he will be an instructor at spring training. He also will serve as a liason between the front office and fans, both by spreading the team's message to the fans, and by relaying fan feedback to the team.

  • For what it's worth, the business and baseball departments are now more closely tied to each other.


Chernoff also fielded a few questions:
  • A SABR member asked why Manny Acta seemed so distant and reserved. Chernoff was a bit surprised, as he sees the manager as an open door guy with the team and the community. As an example, Chernoff noted that Acta is often out on the field with a fungo bat in his hands. Personally, I'd side with Chernoff on Acta - an aloof manager wouldn't be out enjoying Snow Days.

  • Another question was asked about Valbuena. Chernoff didn't sugar coat things, saying that, "It's not like you're sitting there saying he's terrible, and I'm sitting there saying, 'Oh wow this is great!'" He said that the team sees a player that is still young and has tools, with a good minor league track record and one option left. If they get decent defense and good power out of him, he'll stick around. If he plays like last year, he won't just be off the field, he'll be off the team.

  • Someone asked about Hafner's shoulder. Chernoff said that the shoulder is in the best condition it's been in in three to four years, but Hafner still needs to work on it constantly.

  • There was a very good question about psychological tools employed by the team. The Indians do have an on-staff psychologist that meets with the players regularly. Scouts notice players' makeup on and off the field. And all potential draftees are given a psychological test.

  • One questioner mentioned the concerns about Drew Pomeranz's throwing motion. Chernoff said that because of the injury risks, the Indians may consider fast-tracking Pomeranz to maximize what they can get out of him.

  • Alex White is the farthest along of any minor league pitcher. He'll start in AAA, but may reach the majors this season.


Chernoff kept referring to the Indians as a small market team, so there were a few questions about that.
  • He said that the mid-90s were essentially a perfect storm of consequences (my words, not his) that allowed the team to have such a high payroll. The stadium was brand new, the Browns were gone, and Cleveland's economy was doing well. Now, the stadium is one of the oldest in the league (There were cherry pickers parked outside the stadium in several locations for renovations), the Browns are once again the most popular team in Cleveland, and the economy hasn't been great for anyone in the area.

  • The quote of the day from Chernoff: "Really? The Angels can just take on the entire Vernon Wells contract?"

  • Someone asked how the Indians can go from small market to middle market. Chernoff really didn't have an answer, except to say that if the Indians aren't bringing in money in ticket sales, they can't put that money into payroll. He did say the team was working to figure out why Cleveland finished behind teams like Pittsburgh and Kansas City last year when the Tribe has had more recent success than those two clubs.

  • Chernoff said the best way to handle free agent attrition was to focus on trade returns and diversify the "portfolio" of players gotten back. He pointed out that Casey Blake was signed as a 29-year-old minor league free agent, and the Indians eventually got Carlos Santana back for him.

Wednesday, January 26, 2011

2011 Cleveland Indians Lineup by The Book

Last year, Manny Acta made a splash by dropping Grady Sizemore to second in the batting order. This year, he's considering moving him back to leadoff. Is either the right move? And how should the rest of the lineup look?

The Book, one of the best sabermetric books you can find, did extensive work on lineup construction. Their main conclusion was that lineup order didn't matter too much, but it can be optimized for marginal gains. The Book's findings are summarized very well in this Beyond the Boxscore post.

To get the stats for Cleveland's upcoming season, I used the Cairo Projections, which are described (and available for download) here. The nice thing about version 0.5 of this years Cairos is that they include lefty/righty splits. It uses wOBA, which is decribed in detail in the new Frangraphs library. As you can see, wOBA is scaled to be comparable to batting average, with a .321 wOBA being the league average in 2010.

First, here's how the Indians lineup should look against lefties. I took the top nine players in terms of wOBA against lefties, and fortunately things worked out nicely in the field.
ordernameposwOBA
1Shin-Soo ChooRF.343
2Matt LaPorta1B.351
3Shelley DuncanLF.332
4Carlos SantanaC.346
5Austin KearnsCF.342
6Jayson Nix3B.327
7Asdrubal CabreraSS.326
8Travis HafnerDH.326
9Jason Donald2B.325


The glaring omission, of course, is Grady Sizemore. Cairo projects Sizemore to have a wOBA of only .309 against lefties. But if you insist on playing him (both in the name of fan interest, and so Kearns doesn't have to play center), you can remove Hafner from the lineup, DH Duncan, and move Donald up to eighth with Grady batting ninth.

Some other items of note:
  • Everyone in this lineup is projected to hit above a .321 wOBA. That's nice, but .321 was the average in 2010 against all pitchers. The average against lefties in 2011 may be higher or lower.
  • Indians fans should be especially pleased to see such a nice number for Matt LaPorta, especially after his struggles at the plate these past few years.
  • LaPorta and Santana have very similar numbers, but Santana has a slight edge in power, giving him the fourth spot over LaPorta. While Choo also has very good power, his on base percentage is just too good to put anywhere but first.


Now, the lineup against righthanders. Unfortunately I wasn't able to take just the best nine hitters this time. Michael Brantley and Travis Buck both rated ahead of Jack Hannahan. Brantley, Buck, and Duncan all rated ahead of Nix and Donald as well. But somebody has to play second and third base.
ordernameposwOBA
1Shin-Soo ChooRF.390
2Carlos SantanaC.359
3Matt LaPorta1B.332
4Grady SizemoreCF.363
5Travis HafnerDH.342
6Austin KearnsLF.322
7Asdrubal CabreraSS.318
8Jack Hannahan3B.309
9Jayson Nix2B.307


If you don't think Jack Hannahan is going to break camp with the Tribe, feel free to move Nix up a spot in the order and plug Jason Donald's .303 wOBA into the nine hole.

Notes on this lineup:
  • Choo blew everyone away in both on base percentage and slugging. But I chose to hit him leadoff, just to give our best hitter as many at bats as possible.
  • Believe it or not, Sizemore is expected to have better slugging numbers than Santana, and Santana better on base numbers than Sizemore. That's why Grady is hitting fourth and Carlos second.
  • Cabrera, Nix, and Hannahan/Donald will need to be good with the glove to make up for their below-average projections. Other than that, though, this isn't too bad a lineup.


Finally, for those interested, here are the numbers for a few key players who failed to crack either lineup:
namewOBAvs Lvs R
Michael Brantley.310.291.316
Travis Buck.306.288.312
Luis Valbuena.300.286.302
Trevor Crowe.289.283.290
Adam Everett.268.282.264

Wednesday, June 16, 2010

Cleveland Indians Monthly Statistical Analysis

A (hopefully) monthly look at the Tribe's performance from a variety of statistical angles. Suggestions for additional stats and categories are welcome - just let me know.

Overall

Pythagorean Record

One of the most popular judges of a team's performance is their Pythagorean record. "Pythag" is so named because the formula used looks similar to the Pythagorean formula used on right triangles.

Pythag uses runs scored and runs allowed to determine a predicted record. Generally, teams that overperform their Pythags are considered lucky and those that underperformed are considered unlucky. However, small ball teams like the Angels and Twins consistently overperform their Pythagorean records, for reasons saberists have trouble explaining.

So far, the Indians Pythagorean record (which can be found on MLB.com's standings page by turning on the "X W-L" category) is exactly the same as their actual record, 21-34.

Recently, Fangraphs suggested that using runs scored/runs against in-season isn't the best for Pythag. Instead, Base Runs should be used. This blog quickly picked up that idea and ran with it. However, even using base runs, the Indians can't shake their 21-34 record. Projecting that out over the course of the season, the Tribe is looking at a 62-100 record.

Playoff Odds

Several sites offer odds of a team making the playoffs. One such site is CoolStandings.com, which currently has the Indians at a 0.5% chance to win the division and less than a 0.1% chance to win the wildcard.

Baseball Prospectus isn't as optimisitic. Their projections, explained at the bottom of the linked page, have the Indians at 0.14% to win the division and 0.006% to win the wildcard. However, their projected standings do have the Clevelanders finishing at 70-92.

"Wins in the Bank" and the Gambler's Fallacy


Several sites also post preseason standings projections. This is where the "gambler's fallacy" comes in. BaseballProjection.com has the Indians going 81-81 on the season, yet they have gone 21-34 so far.

Someone following the gambler's fallacy would think that the Tribe will go 60-47 the rest of the season to finish 81-81. In fact, Chone's projection should be thought of as a winning percentage, not a definite number of wins and losses.

That is, we should accept the fact that the Indians are 21-34, and assume they will play .500 ball (81 wins/162 games) the rest of the way. That means the Indians should expect to win 53-54 of their remaining 107 games, for a final record of (at best) 75-87.

Pitching

BABIP

One of the most consistent statistics in baseball is a pitcher's batting average on balls in play (BABIP). The more a pitcher throws, the more his BABIP will settle in the .290-.300 range. (Thank you to the commenter who corrected me last month. This is true for nearly all pitchers, with only rare exceptions like Jim Palmer, who had a great defense in Baltimore.

That being said, if you see a pitcher with a high BABIP early in the season, you can expect that BABIP - and his overall performance - to improve. Conversely, pitchers with a low BABIP can expect an increase.

According to Fangraphs, Jake Westbrook and Chris Perez are already in the .290-.300 range. Those two have put up decent numbers and should expect to continue at the same pace. That may be good news for the Indians front office, who could potentially swap Westbrook for some prospects within the next two months.

Cleveland's two best starters, Fausto Carmona and Mitch Talbot, have been beneficiaries of below-average BABIPs and can look forward to some minor regression. The same goes for relievers Tony Sipp, Joe Smith, and Frank Hermann. In fact, Sipp may have already seen the start of that regression during Cleveland's most recent road trip. Smith and his 7.71 ERA, meanwhile, won't take kindly to the notion that he's been lucky in a good sense. Hermann has been lights-out in a limited Major League debut, but he can't keep up this level of talent forever.

Meanwhile, a majority of the Tribe's staff should see their luck increase. David Huff and Aaron Laffey are due for some minor improvement, while the embattled Kerry Wood, Justin Masterson, Rafael Perez, and Hector Ambriz should see drastic drops in their BABIP as the season progresses.


Fielding Independent Pitching

While BABIP looks only at balls put into play, fielding independent pitching (FIP) does the opposite. FIP looks at walks, strikeouts, and home runs - the three things that are supposedly the pitcher's responsibility. In other words, FIP looks at those things that can't be affected by the quality of the defense.

FIP is calculated on the same scale as ERA, so the two can be compared easily. If a pitcher's FIP is lower than his ERA, he can expect improvement, and vice-versa. Of course the major caveat here is that if a pitcher plays with the same defense all year, how much can it really improve?

Half of the Indians staff has a FIP within 1.00 of their ERA. Chris Perez, Frank Hermann, and Mitch Talbot are greatly outperforming their FIP, while Justin Masterson, Aaron Laffey, Rafael Perez, and Kerry Wood are greatly underperforming it.


Hitting

Lineup Analysis

BABIP can be used to study a hitter's luck. But unlike pitchers BABIP, hitter's BABIP normalizes to the hitter's past performance, not an overall league average. I'll leave that as an exercise to the reader.

Instead, for hitters we'll again refer to Dave Pinto's lineup analysis tool. Plugging in the top nine Indians in terms of OPS, here are the results. How plausible is the lineup? Not very, unless you can convince one of the outfield/first base/DH-types to catch.

This theoretical lineup would score 5.138 runs per game, much better than the 4.036 the team is currently scoring. That's an extra 178.5 runs for the year, or 18 wins. Of course, that's based on some small sample sizes, and a less than stellar defense.

Wednesday, May 12, 2010

Cleveland Indians Monthly Statistical Analysis

A (hopefully) monthly look at the Tribe's performance from a variety of statistical angles. Suggestions for additional stats and categories are welcome - just let me know.

Overall

Pythagorean Record

One of the most popular judges of a team's performance is their Pythagorean record. "Pythag" is so named because the formula used looks similar to the Pythagorean formula used on right triangles.

Pythag uses runs scored and runs allowed to determine a predicted record. Generally, teams that overperform their Pythags are considered lucky and those that underperformed are considered unlucky. However, small ball teams like the Angels and Twins consistently overperform their Pythagorean records, for reasons saberists have trouble explaining.

Likewise, Eric Wedge's teams traditionally underperformed their Pythagorean record. That may be because those teams sprinkled 15-run wins between seven-game losing streaks. So, it will be interesting to see how Manny Acta's teams perform against Pythag.

So far, the Indians Pythagorean record (which can be found on MLB.com's standings page by turning on the "X W-L" category) is exactly the same as their actual record, 11-18.

Playoff Odds

Several sites offer odds of a team making the playoffs. One such site is CoolStandings.com, which currently has the Indians at a 1.4% chance to win the division and a 0.5% chance to win the wildcard.

Baseball Prospectus is a little more optimistic. Their projections, explained at the bottom of the linked page, have the Indians at 3% to win the division and 0.9% to win the wildcard.

"Wins in the Bank" and the Gambler's Fallacy

Several sites also post preseason standings projections. This is where the "gambler's fallacy" comes in. BaseballProjection.com has the Indians going 81-81 on the season, yet they have gone 11-18 so far.

Someone following the gambler's fallacy would think that the Tribe will go 70-63 the rest of the season to finish 81-81. In fact, Chone's projection should be thought of as a winning percentage, not a definite number of wins and losses.

That is, we should accept the fact that the Indians are 11-18, and assume they will play .500 ball (81 wins/162 games) the rest of the way. That means the Indians should expect to win 66-67 of their remaining 133 games

Pitching

BABIP

One of the most consistent statistics in baseball is a pitcher's batting average on balls in play (BABIP). The more a pitcher throws, the more his BABIP will settle in the .270-.290 range. This is true for nearly all pitchers, with only rare exceptions like knuckleballer Tim Wakefield and control specialist Greg Maddux.

That being said, if you see a pitcher with a high BABIP early in the season, you can expect that BABIP - and his overall performance - to improve. Conversely, pitchers with a low BABIP can expect an increase.

According to Fangraphs, David Huff, Jensen Lewis, and Aaron Laffey are already in the .270-.290 range. That's good news for all three, as they have pitched fairly well this season (outside of Huff's win-loss record) and should expect that performance to continue.

Cleveland's two best starters, Fausto Carmona and Mitch Talbot, have been beneficiaries of BABIPs in the .250s and can look forward to some minor regression. The same goes for relievers Chris Perez and Tony Sipp. Meanwhile, Joe Smith and Jamey Wright should see their already high ERAs rise with their BABIPs.

Meanwhile, Jake Westbrook and Justin Masterson should see their traditional numbers improve as their BABIPs decrease. As should Rafael Perez and Kerry Wood, which is good news for their respective ERAs. Hector Ambriz, pitching well by traditional measures, should only get better as his BABIP lowers. Not bad for a Rule V pickup.

Fielding Independent Pitching

While BABIP looks only at balls put into play, fielding independent pitching (FIP) does the opposite. FIP looks at walks, strikeouts, and home runs - the three things that are supposedly the pitcher's responsibility. In other words, FIP looks at those things that can't be affected by the quality of the defense.

FIP is calculated on the same scale as ERA, so the two can be compared easily. If a pitcher's FIP is lower than his ERA, he can expect improvement, and vice-versa. Of course the major caveat here is that if a pitcher plays with the same defense all year, how much can it really improve?

The bad news is that everyone except Jamey Wright, Justin Masterson, Rafael Perez, and Kerry Wood are posting FIPs lower than their ERAs. The even worse news is that Wright's FIP is only 0.40 points lower, and Wood's is based on only one inning of work.

Hitting

Lineup Analysis

BABIP can be used to study a hitter's luck. But unlike pitchers BABIP, hitter's BABIP normalizes to the hitter's past performance, not an overall league average. I'll leave that as an exercise to the reader.

Instead, for hitters we'll again refer to Dave Pinto's lineup analysis tool. Plugging in the top nine Indians in terms of OPS, here are the results. The lineup is certainly plausible in terms of defensive alignment and batting order, assuming Russell Branyan can still play some outfield.

This theoretical lineup would score 5.232 runs per game, much better than the 3.8 the team is currently scoring. That's an extra 232 runs for the year, or 23 wins. Of course, that's based on some small sample sizes, even for the regulars.

Friday, March 26, 2010

MLB Preview #6
American League Central

Minnesota Twins

Baseball America Top 10 Prospects

Lineup
Denard Span CF
Orlando Hudson 2B
Joe Mauer C
Justin Morneau 1B
Mike Cuddyer RF
Jim Thome DH/Delmon Young LF
Jason Kubel LF/DH
JJ Hardy SS
Nick Punto/Brendan Harris 3B

Rotation
Scott Baker
Kevin Slowey
Carl Pavano
Nick Blackburn
Francisco Liriano
Brian Duensing


The Twins simultaneously upgraded at shortstop and center field by trading Carlos Gomez for JJ Hardy. Denard Span's defense is arguably on par with Gomez', plus Span has a much better bat. The Twins will need all the range Span can give them if he's going to be sharing an outfield with Kubel and Cuddyer. Presumably, we'll see the Kubel/Thome combination against righties, and Young/Kubel or Young/Thome against lefties. Despite all their moves, including the addition of an increasingly league-average Orlando Hudson, the Twinkies still have a hole at third base. Whether that's filled by no-longer-a-prospect Brendan Harris or the good glove/no hit Nick Punto will probably depend on the matchup.

Jose Morales will be Joe Mauer's injury insurance this year, while Matt Tolbert will be waiting to take innings from Harris, Punto, and the other infielders.

Minnesota's pitching rotation has always been full of young talent, and this year is no different. However, for those who didn't pay attention to baseball for the past few years, it may come as a surprise that Scott Baker is the staff ace and Francisco Liriano is fighting to even make it into the rotation. The addition and retention of Carl Pavano will help this club's playoff run. Notre Dame product Jeff Manship will also try to work his way into the mix after making his Major League debut last year.

The Twins may have lost Joe Nathan for the season, but the bullpen has always been the Future Closers of America club. Veteran Jon Rauch will step in for the time being, but Minnesota may still look for a trade. Rauch will be supported by Matt Guerrier, Pat Neshek, and Jesse Crain.

Cleveland Indians

Baseball America Top 10 Prospects

Lineup
Asdrubal Cabrera SS
Grady Sizemore CF
Shin-Soo Choo RF
Russell Branyan 1B
Travis Hafner DH
Jhonny Peralta 3B
Matt LaPorta LF
Lou Marson C
Luis Valbuena 2B

Rotation
Jake Westbrook
Fausto Carmona
Justin Masterson
Aaron Laffey
Mitch Talbot
David Huff


Even this optimistic Indians fan was surprised by CHONE's prediction of a second place finish for the Tribe. Still, they have the weapons to do it if everything comes together correctly. Shin-Soo Choo and Grady Sizemore are the stars, and the supporting cast is starting to come together nicely. Much was made of Sizemore's drop to the second spot in the lineup, but many projection systems say that's where a team's best hitter should hit. The decision will be much easier to swallow if Asdrubal Cabrera can again hit like he did last year. With Russell Branyan and Travis Hafner, the big issue as always will be health. Branyan has yet to play this spring, which could lead to Austin Kearns taking his spot on opening day. Meanwhile, Lou Marson will play the Josh Bard to Carlos Santana's Victor Martinez to start this season.

All signs point to the Indians keeping Michael Brantley in the minors to start the season, even with Branyan's injury. The idea is to delay Brantley's arbitration clock. It could mean that Trevor Crowe starts the season with the parent club, since he can back up all three outfield positions. Mike Redmond was added as a veteran presence not only for a young pitching staff, but also for a young catching unit. It looks like Redmond will be Fausto Carmona's personal catcher as the latter looks to get back on track. A number of players are fighting for the backup infield spot, including the infamous Andy Marte, new acquisition Anderson Hernandez, and non-roster invitee Mark Grudzielanek.

Only three spots are set in the starting rotation at this point. Jake Westbrook will pitch opening day, followed by Carmona, followed by Justin Masterson. The last two spots will go to two of Aaron Laffey, Mitch Talbot, and David Huff, with Talbot expected to win a place by default since he is out of options. But as on any rebuilding team, there will be plenty of pitchers earning starts on this team. Jeremy Sowers will fight injuries and ineffectiveness in what may be his last hurrah with the team, while Carlos Carrasco will try to prove he's had enough minor league seasoning to get the call.

Rumors that Kerry Wood would be traded to the Twins to replace Joe Nathan were quickly squashed when it was discovered that Wood himself would lose two months due to injuries. That just turns Chris Perez, Future Closer into Chris Perez, Current Closer. Perez will be aided by a number of pitchers looking to prove themselves after ineffective 2009 campaigns, including Joe Smith, Rafael Perez, and Jensen Lewis. Rule V pickup Hector Ambriz will also try to contribute from the pen.


Chicago White Sox

Baseball America Top 10 Prospects

Lineup
Juan Pierre LF
Gordon Beckham 2B
Carlos Quentin RF
Paul Konerko 1B
Alex Rios CF
Andruw Jones DH
AJ Pierzynski C
Alexei Ramirez SS
Mark Teahen 3B

Rotation
Mark Buehrle
Jake Peavy
Gavin Floyd
John Danks
Freddy Garcia
Dan Hudson


The White Sox started with a good concept: a young core of Beckham, Quentin, and Ramirez complemented by veterans Konerko and Pierzynski. But the additions of Juan Pierre, Andruw Jones, and Mark Teahen were questionable at best. (I'll let the reader decide where Alex Rios falls in this equation.)

Chicago's reputation as an aging team was reversed somewhat by the loss of Jim Thome and Jermaine Dye. However, all credit gained in those moves was lost in the acquisitions of Omar Vizquel, Mark Kotsay, and Ramon Castro to man the bench.

CHONE has four White Sox starters - Buehrle, Peavy, Floyd, and Danks - posting 3.5 WAR seasons. That depth is matched by few teams in this league, if any. The only question is the fifth spot, which will either go to journeyman Freddy Garcia or youngster Dan Hudson.

Since it became a regular division contender in the 2000s, Chicago has always had a steady bullpen. Former Seattle closer JJ Putz will now be setting up Bobby Jenks. The duo will be joined by Matt Thornton and Scott Linebrink.

Detroit Tigers

Baseball America Top 10 Prospects

Lineup
Johnny Damon LF
Carlos Guillen DH
Magglio Ordonez RF
Miguel Cabrera 1B
Brandon Inge 3B
Gerald Laird C
Scott Sizemore 2B
Adam Everett SS
Austin Jackson CF

Rotation
Justin Verlander
Rick Porcello
Jeremy Bonderman
Max Scherzer
Eddie Bonine
Nate Robertson
Dontrelle Willis


Are the Tigers rebuilding, or aren't they? By letting go of Curtis Granderson and Placido Polanco in favor of calling up Austin Jackson and Scott Sizemore (in addition to trading Edwin Jackson for Max Scherzer), it seems Detroit is favoring the future over the present. Why then sign Johnny Damon. Regardless of how you slice it, this is a batting order whose offense falls off sharply after the top five. Sure Detroit will have a solid defense with Laird, Everett, Inge, and now Damon, but will they hit well enough to match it?

On the bench, Ramon Santiago is back once again as the Tigers utility infielder. Clete Thomas and Ryan Raburn will fight for a backup role in the outfield, although both could see decent playing time if age catches up to Ordonez and Damon, or lack of experience catches up to Jackson.

There's Verlander, and then there's everyone else. Handing Rick Porcello the second spot in the rotation is risky, especially since the 21-year-old is due for some regression after an impressive 2009. Jeremy Bonderman and Max Scherzer have locked up rotation spots, although there's some question as to whether the latter is ready yet to be a starter. The fifth spot is still open, although recent indications give the job to Nate Robertson over Bonine or Willis.

The Tigers went outside of the organization to pick up closer Jose Valverde. He'll be set up by Joel Zumaya, Bobby Seay, Zach Miner, and former Yankee Phil Coke. Daniel Schlereth, a top prospect and son of the ESPN football commentator, will also try to win a spot in the bullpen.

Kansas City Royals

Baseball America Top 10 Prospects

Lineup
Scott Podsednik LF
David DeJesus RF
Rick Ankiel CF
Jose Guillen DH
Billy Butler 1B
Alberto Callaspo/Chris Getz 2B
Alex Gordon 3B
Jason Kendall C
Yuniesky Betancourt SS

Rotation
Zack Greinke
Gil Meche
Luke Hochevar
Kyle Davies
Brian Bannister
Robinson Tejada


The Royals claim to preach getting on base. But then they surround their homegrown talent with signings like Scott Podsednik, Jason Kendall, and Yuneski Betancourt. Even Rick Ankiel isn't the hitter he once was. Go figure, then, that David DeJesus, Billy Butler, and Alex Gordon are the only players CHONE predicts to play above replacent level this year.

As with most mediocre teams, the Royals have a number of so-so players fighting it out for bench spots. Mike Aviles, Mitch Maier, super-utilityman Willie Bloomquist, and White Sox castoffs Josh Fields and Brian Anderson all look to make the club this year.

In 2009, Zack Greinke had a legitimate argument for league MVP. This year, he'll look to make another run at the trophy that has traditionally gone to position players. Supporting him are decent starters in Meche, Hochevar, and Bannister, and passible candidates in Davies and Tejada.

Rule V pickup Joakim Soria surpassed everyone's expectations. But for every Soria there are dozens of Kyle Farnsworths, Juan Cruzes, and Anthony Lerews - players moved to relief because they could never live up to the hype.

Wednesday, February 24, 2010

Cleveland Indians: CHONE's WAR Gives Hope for a Winning Season

The Cleveland Indians may be rebuilding again, but it's hard not to be optimistic when CHONE predicts the team to win at least 81 games and finish second in the division.

Let's take a closer look at those projections, using WAR - Wins Above Replacement.

For those unfamiliar with the stat, WAR compares a given player to a replacement player - basically, any random guy you'd pull out of AAA. WAR is nice because it takes into account defense and position difficulty (it's harder to play shortstop than left field) in addition to offense.

It's said that a team of nothing but replacement players will win 47 games. So let's start with that as our baseline.

First, we'll look at the position players. FanGraphs includes this year's CHONE projections, and even gives a WAR number. So that makes things easy. Here are the position players on the 40-man roster.
PlayerWAR
Grady Sizemore5
Shin-Soo Choo3.1
Asdrubal Cabrera2.8
Jhonny Peralta2.2
Luis Valbuena1.5
Matt LaPorta1.3
Louis Marson1.2
Travis Hafner1.2
Brian Bixler1
Michael Brantley1
Mike Redmond0.8
Trevor Crowe0.8
Wyatt Toregas0.8
Jordan Brown0.6
Carlos Santana0.4
Andy Marte0.3
Nick Weglarz-0.1
Chris Gimenez-0.5
Jason Donald-1
Wes Hodges-1.1
Carlos Rivero-1.3

Sizemore and Choo are really good, but you already knew that.

Next, the Non-Roster Invitees.
PlayerWAR
Shelley Duncan1.5
Russell Branyan1.2
Brian Buscher1
Austin Kearns0.7
Luis Rodriguez0
Mark Grudzielanek-0.3
Damaso Espino-0.7
Niuman Romero-1.1
Beau Mills-1.2
Lonnie Chisenhall-1.8


Assuming we assemble a 25-man roster with 13 position players and 12 pitchers, here are the best possible position players we could take.
PlayerWAR
Grady Sizemore5
Shin-Soo Choo3.1
Asdrubal Cabrera2.8
Jhonny Peralta2.2
Luis Valbuena1.5
Shelley Duncan1.5
Matt LaPorta1.3
Louis Marson1.2
Travis Hafner1.2
Russell Branyan1.2
Brian Bixler1
Michael Brantley1
Brian Buscher1

OK, so we're short a catcher - that won't work.

Now, here's my best guess at what the actual opening day lineup will look like.
PlayerWAR
Louis Marson1.2
Matt LaPorta1.3
Luis Valbuena1.5
Jhonny Peralta2.2
Asdrubal Cabrera2.8
Michael Brantley1
Grady Sizemore5
Shin-Soo Choo3.1
Travis Hafner1.2
Mike Redmond0.8
Brian Bixler1
Andy Marte0.3
Russell Branyan1.2

The realistic lineup gives us 22.6 WAR, and the best-case gives us 24. Add that to our baseline of 47 wins, and we're already on pace to win 69-71 games.

Now, the pitchers. CHONE's website itself lists Runs Vs. Replacement for pitchers, which is nice. The common standard is that 10 runs = 1 win, so we'll divide the R vs. Rep by 10 to get each player's WAR.

Here are the pitchers on the 40-man.
PlayerWAR
Justin Masterson2.7
Fausto Carmona2
Aaron Laffey1.9
Jeremy Sowers1.5
David Huff1.4
Hector Rondon1
Jake Westbrook1
Hector Ambriz0.8
Carlos Carrasco0.6
Kerry Wood0.6
Mitch Talbot0.6
Rafael Perez0.6
Chris Perez0.5
Jensen Lewis0.5
Jess Todd0.4
Tony Sipp0.4
Joe Smith0.3
Jeanmar Gomez-0.8

CHONE didn't have a projection for Kelvin De La Cruz. But boy, it sure is high on Justin Masterson, isn't it?

The non-roster invitees.
PlayerWAR
Anthony Reyes0.9
Jason Grilli0.6
Mike Gosling0.2
Saul Rivera0.2
Frank Herrmann-0.1
Josh Judy-0.1
Zach Putnam-0.3

Alex White and Yohan Pino didn't get CHONE projections.

Here's the best possible group of 12 pitchers.
PlayerWAR
Fausto Carmona2
Aaron Laffey1.9
Jeremy Sowers1.5
David Huff1.4
Hector Rondon1
Jake Westbrook1
Anthony Reyes0.9
Hector Ambriz0.8
Carlos Carrasco0.6
Kerry Wood0.6
Mitch Talbot0.6

Rafael Perez is also at 0.6, so feel free to substitute him in for Carrasco, Wood, or Talbot as you see fit.

Here's my best guess at the opening day staff. I wasn't sure quite how it was going to turn out, so I started with the guys under contract (Westrbook, Wood, Carmona, and Perez), added rule 5 pickup Ambriz, then just went in descending order by WAR after that.
PlayerWAR
Jake Westbrook1
Kerry Wood0.6
Fausto Carmona2
Rafael Perez0.6
Hector Ambriz0.8
Justin Masterson2.7
Aaron Laffey1.9
Jeremy Sowers1.5
David Huff1.4
Hector Rondon1
Carlos Carrasco0.6
Mitch Talbot0.6


The best possible scenario clocks in at 15 total WAR, and the "realistic" one comes in just under that at 14.7. Add that to our 47-win baseline and the 22-24 wins by the hitters, and we're looking at a team that should win at least 80 games and could win as many as 87.

Of course, a word of caution: it was these types of sabermetric projections that predicted the Tribe to win the Central in '06, '08, and '09. But still, it's February, so why not be optimistic?

Thursday, January 07, 2010

Cleveland Indians: A Look at Baseball America's 2010 Top Prospect List

The other day, Baseball America released their Top 10 Indians Prospects for 2010. This announcement is always fun, because not only does it list the best up-and-comers in the organization, but it also looks at the best tools and tries to predict a future lineup. In this case, BA looks ahead to the year 2013.

The Prospects List

Carlos Santana is once again atop the list, and he is surely the centerpiece of the Tribe's next title run. After leading the Aeros to a AA title in 2009, it may only be a matter of time before Santana makes his MLB debut.

Hot on Santana's heels is Lonnie Chisenhall. The Indians were panned for going off-the-board and taking Chisenhall in the supplemental first round two years ago. But since then, he's done nothing but hit. Chisenhall was never expected to stick at shortstop, and in fact he has already made the move to third. Barely 21, and in the pros for barely over a year, Chis has already made it to AA. At this pace, he's en route to a long, successful Major League career.

In both the Victor Martinez and Cliff Lee trades, the Indians acquired a very young potential ace. Those aces are Nick Hagadone and Jason Knapp, and their potential put them in the top four on BA's list. Cleveland fans will have to wait a while for the payoff, but it should be sweet.

Michael Brantley held his own in the Majors last year, and in doing so may have won the starting left field job in 2010. Had it not been for injuries, we may have been talking about Canadian hero Nick Weglarz in that spot. The two are a contrast in styles: Brantley is a speedy contact hitter, and Weglarz is pure power.

Hector Rondon joins Weglarz as the only players in the Indians organization prior to 2008 who made this list. Rondon has slowly and surely worked his way up the prospect list, and that patience should pay off sooner rather than later.

Carlos Carrasco is raw with ace potential. Unfortunately, he may be more raw than potential. However, a good spring training could land him in the starting rotation this year.

The list is rounded out by a pair of 2009 draft picks. Alex White was drafted as a reliever, and Baseball America seems to think he'll stick there as the Tribe's future closer.

This Year's List vs. Last Year's

Matt LaPorta and David Huff graduated, although I'm sure both wished for better rookie seasons. Also gone are Adam Miller, Beau Mills, Kelvin de la Cruz, and Carlos Rivero, all hampered by injuries, poor seasons, and the new infusion of talent in the system. That's not to say these guys won't be back on the list, or even in the Majors, next year.

Chisenhall was the noted big riser, but Brantley impressed as well by letting his playing do the talking. Weglarz dropped a bit, mostly due to poor performance that was the result of a broken foot.

Best Tools

There weren't many surprises here, and not many changes here. Guys like Brantley, Santana, and Hagadone earned their spot in the top 10 with multiple appearances on this list. Also of note is that Jason Donald was named Best Defensive Infielder. Part of the Lee trade, Donald may stick with the parent club this year as a utility infielder.

Cleveland Indians Projected 2013 Lineup

Holy turnover! Of the top 10, all but Kipnis are expected to be regulars by 2013. But that's not surprising for a rebuilding team, and it also shows that the Indians are rebuilding with a purpose.

There's no big surprises among the position players. Luis Valbuena, Asdrubal Cabrera, Grady Sizemore, Shin-Soo Choo, and Brantley are all young players already expected to start in 2010. Santana and LaPorta are known to be the heirs apparent at their respective situations. And the phasing out of Jhonny Peralta and Travis Hafner should come as no surprise to Indians fans.

The turnover in the pitching rotation is radical, however. Only Carrasco and Justin Masterson survive from last year. What of Jake Westbrook, Fausto Carmona, and Aaron Laffey?

Westbrook's contract is up after this year, and resigning the veteran will probably not be in this rebuilding club's plans, for better or worse. The Indians have club options on Carmona from 2012 through 2014, and at his current rate of performance he may not survive that first round. Laffey may simply be an oversight on BA's part based on injuries and inconsistency this past year.

Thursday, July 23, 2009

Weekly Cleveland Indians Lineup Analysis

Well, it hasn't exactly been weekly this season, but let's hope it is from here on out. To recap, we take the top 9 Indians in terms of OPS and feed them into Dave Pinto's Lineup Analysis Tool to determine the theoretical ideal batting lineup.

This Week's Results
Click Here

This Week's Ideal Lineup
Choo
Martinez
Cabrera
Hafner
Garko
Sizemore
Francisco
Peralta
Carroll

Theoretical Runs Per Game
5.297

Theoretical Improvement
The Indians are currently scoring 4.938 runs per game, which isn't too bad in its own right. The ideal lineup is an improvement of 0.360 runs per game, or 58 runs over the course of a season. That may not seem like much, but using the old sabermetric standby that 10 runs = 1 win, that's another 5-6 victories for the Tribe. Of course, they'd still be 7 games back in the division.

Defensive Plausibility
Well, it's pretty much the same nine guys Cleveland trots out for every other game, so there are no problems here.

Fan Believability
It's hard to argue batting Hafner, Garko, Francisco, Peralta, and Carroll where they are. Choo's pretty realistic too, since he gets on base and runs relatively well (for this team). But even in the midsts of a down season, fans would riot at Grady Sizemore hitting sixth. In addition, no coach on the hot seat would bat Victor Martinez second but Asdrubal Cabrera third.

My Take
It's been a while since I've done a lineup analysis. So I'm happy how this turned out, because it gives me another chance to demonstrate how the lineup tool "envisions" each spot in the batting order. As with a traditional lineup, the best on-base guy bats leadoff and the biggest masher hits cleanup. Shin-Soo Choo leads the team in on base percentage, while Travis Hafner leads the team in slugging.

The number two hitter is supposed to be your best all-around hitter - good in both OBP and SLG, but one isn't drastically higher than the other. Check that one off with Victor Martinez. The number five guy is your second-best all-around hitter. To Nino's delight, I'm sure, that's Ryan Garko.

What's interesting is the number three spot. Contrary to popular thought, this model normally puts a bad hitter there, just for lack of a better spot, and with the intent to space out the out-makers. But Asdrubal Cabrera is fifth on the team in OPS, so I'm not sure why he was placed there.

Your number nine guy isn't necessarily a good hitter, but it should be someone who can get on base. That's Jamey Carroll in a nutshell. The rest of the lineup, spots six through eight, are whoever's left in descending order of ability.

Random Indians Thought of the Week
This week I have two thoughts, and they're not so random because they still pertain to this lineup analysis.

It's a small sample of only 20 at bats, but Josh Barfield is actually third on the team in OPS this year. I'll leave a lineup analysis that includes him as an exercise for the reader.

Also, coming into Thursday's game against the Blue Jays, Chris Gimenez had a higher OPS than Jhonny Peralta on the year, meaning I would have used Gimenez instead of Peralta in this week's analysis. Interestingly, both Barfield and Gimenez could replace Peralta at third to keep the lineup defensively plausible.

As it stands, Peralta, Gimenez, and Kelly Shoppach are all in a very close race for the ninth-best OPS on the team. In a year like this, I'm actually curious to see how Shoppach would fare at the hot corner.

Thursday, April 30, 2009

Jhonny Peralta: Cold Like the Weather

From Andy Castrovince's latest mailbag:
I'd be interested to see Jhonny Peralta's batting average in warm weather vs. cold weather. He was red hot down in Arizona this spring, but now he seems ice cold, much like the first six weeks of last season. Great Odin's raven, am I on to something here?
-- Tim R., San Diego

I'd love to help you find those numbers, but, much like the translation of the name for your hometown, scholars maintain that the ability to calculate such statistics was lost hundreds of years ago.

Actually, I asked hitting coach Derek Shelton and media relations director Bart Swain if they've ever heard of such a stat, and neither has. You'd really have to be the obsessive-compulsive type (even by baseball statistician standards) to calculate those numbers, especially when you consider the temperature at first pitch can take a drastic dip by the last pitch.

Well, when it comes to the Indians (and especially Peralta, apparently), I am that obsessive-compulsive baseball statistician. After reading the question, I immediately thought, "I bet Retrosheet tracks weather information. Sure enough, they do.

If you want me to bore you with the details, email me. Otherwise, let's skip to the pretty picture:


The short explanation is that I took Peralta's batting average (hits/at bats, obviously) for each gametime temperature reading. As you can see, there is an upward trend. Thoughts:
  • There's no context. Maybe all, or at least most, hitters follow the same trend. That would make this "revelation" meaningless.

  • Correlation is not causation. It's warm at midseason, when hitters are thought to be at their best, and when the ball is said to travel better. It's cold at the beginning of the season, when hitters aren't yet in "midseason form", and at the end, when fatigue starts to set in. So, again, maybe this is a trend for everyone and not just Jhonny.

  • I'd be interested to see weather-related trends for other statistics, starting with BABIP and OPS, and perhaps moving onto the more advanced stuff.

Tuesday, February 24, 2009

An Exciting Day for Baseball Fans

What a day, especially if you're a prospect nerd. On the same day the Indians held their first intrasquad game, the final World Baseball Classic rosters were announced, AND Baseball America released their top 100 prospects for 2009.

The Indians were represented well on both lists. The WBC will feature
  • Grady Sizemore and Mark DeRosa on Team USA
  • Shin-Soo Choo playing for Korea
  • Rafael Perez pitching for the Dominican Republic
  • prospects Damaso and Paolo Espino on the Panamanian team
  • Chen Lee and Sung-Wei Tseng wearing the uniforms of Chinese Taipei
  • and up-and-comer Nick Weglarz once again representing Team Canada

The US is only carrying four true outfielders, so I wouldn't be surprised if DeRosa saw some time in the outfield as well.

On Baseball America's list, Carlos Santana and Matt LaPorta checked in consecutively at 26th and 27th. The aforementioned Nick Weglarz is 58th. And Adam Miller was 82nd. BA expects LaPorta and Miller to make their MLB debuts this year, with Santana and Weglarz hitting The Show in 2010.

Monday, January 19, 2009

Sabermetrics 101: Fielding Statistics

Don't worry, there is very little math involved this time.

For many years, sabermetricians ignored fielding, at least partially because it was so much harder to quantify compared to hitting.

The original fielding metric is fielding percentage, (outs + assists)/(outs + assists + errors). That was fine in the 1800s, when it's been argued that players weren't expected to catch anything that wasn't hit right at them. To this day, errors are still subject to the opinion of the official scorer, as witnessed recently by CC Sabathia's lost no hitter on a bunt single and Orlando Cabrera's in-game call to the press box to have an error changed to a hit.

So errors and fielding percentage are probably not the best way to judge a fielder. Then, what is? Arguably, there are two ways to do so: noting whether a fielder got to a ball (or whether they should have), and whether they actually fielded it once they got there. (Throwing ability - accuracy and strength - are another issue, but we won't go into that today.) Brian Cartwright wrote an excellent piece for Fangraphs the other day, explaining why fielders with poor range are better at actually fielding the ball, and vice-versa.

Other Fielding Statistics

As mentioned above, sabermetricians avoided fielding for a long time because it was difficult to quantify. Now, a variety of fielding measures exist, and still we have none that stands head and shoulders above the rest. Here are just a few metrics that exist today.
  • Range Factor: Bill James' first crack at a fielding statistic, Range Factor is the number of plays a fielder makes per nine innings. In other words, it's basically the fielding equivalent of ERA. Of course, like ERA the system has its drawbacks. For example, the type of pitcher (flyball vs. ground ball) will affect the number of chances a fielder has in a game.

  • Zone Rating: STATS Inc. divided the field into zones and calculates Zone Rating as the number of outs made in a fielder's designated zones divided by the total number of balls hit into that zone.

  • John Dewan's Plus/Minus: Like many of these fielding stats, Plus/Minus involves watching video of every single play over the course of a season and charting whether a fielder should have made the play. In this case, Baseball Info Solutions (BIS) assigns a "plus" for every play made that someone else at that position didn't make, and a "minus" for every play not made that someone else at that position made.

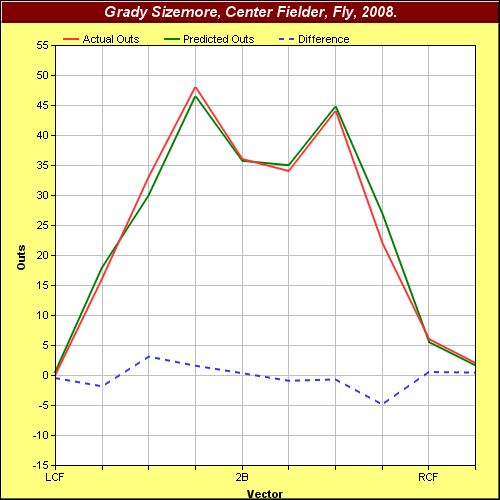
  • Probabilistic Model of Range: Created by Dave Pinto, a former ESPN and STATS, Inc. statistician, PMR is another way of comparing a fielder's performance relative to his peers. PMR views the field as a right angle, and breaks fielding down by angle relative to the foul lines. That information can be used to create graphs like this one, which shows that in 2008, Grady Sizemore was slightly above average (compared to other center fielders) on fly balls hit to his right, but slightly below average on flies to his left.

  • Ultimate Zone Rating: A continuation of Zone Rating, Mitchel Lichtman's UZR is actually calculated two ways: using BIS's data and using STATS Inc.'s data. Here is a comparison of the two UZR ratings and PMR.

  • Fan Scouting Report: For those of you that don't like math at all (except for counting), this is the stat for you. Tangotiger's Fan Scouting Report is a crowdsourced scouting report that ranks fielders in terms of instincts, first step, speed, hands, release, arm strength, and throwing accuracy.

  • : If the Fan Scouting Report is perfect for those who don't like math, than Colin Wyers' graphs are perfoect for those who don't even like words. Colin simply took the location of every fielded ball and plotted it on a graph, with a baseball field laid as the backround. Here's a comparison of Troy Tulowitzki and Derek Jeter's 2007 fielding.


The Next Steps

Fielding statistics still have many unsolved questions, but two of the main issues are determining a fielder's starting position, and determining teammates' influence on fielding statistics.

The comments of this thread have a discussion of fielders' starting position. As the charting and video coverage of games improve (PitchF/X, HitF/X, and the work BIS and STATS do), this area will improve as well. Of course, starting position needs to be taken in context. If a fielder is always standing in the right place at the right time, they certainly should get credit for knowing where to stand (or at least his coaches should get credit). But standing in the right place means he won't have as far to run to get to a ball, and therefore it will seem as if he doesn't have much range. So statisticians will have to be careful not to punish him for that.

Another issue is the affect teammates have on each other. For example, on a ball hit between the first and second baseman, the first baseman has the first attempt at the ball because he's positioned closer to first base. A second baseman would only have a chance at the ball if the first baseman couldn't get to it.

Take a look at the PMR ground ball charts for Ryan Howard, Chase Utley, Albert Pujols, and Aaron Miles. At first it looks like Miles is below average at ground balls towards first base. But perhaps that is because Pujols is getting to many of the balls that normally would have gone through to his second baseman. Likewise, Chase Utley appears to be great at getting ground balls towards first base, but only because Ryan Howard is below average at fielding balls in that direction. Trade Utley for Miles (a move the Phillies surely would never make), and you would probably see Utley's PMR decline and Miles' improve.

Of course, PMR also does not indicate starting position. Knowing that Howard isn't a great fielder, maybe Utley positions himself a little closer to first base to make up for it. And maybe Miles positions himself a little farther from second base to account for Pujols' range. But if that was the case, you would expect Utley to have below-average performance on balls hit towards second base, and Miles to have above-average performance. In reality, the graphs show that Utley is above average in both directions, while Miles is only average on balls hit towards second base. So, Utley had a phenomenal 2008 in the field, a fact corroborated by his unheard of +47 rating in John Dewan's Plus/Minus system.

The Jhonny Peralta Problem

One of the big questions for Cleveland Indians fans is Jhonny Peralta's defense. Most fans want him to move to third base, but in the past I have suggested a move to second base.

How does Peralta rate as a shortstop? According to PMR (2006, 2007, 2008), he's actually around average on grounders, and maybe even a little above average on fly balls and liners. But UZR gives him a negative rating for every year after his rookie season.

Working on the assumption that he's a below-average shortstop (even if that disagrees with PMR), where should he move? As per this discussion, shortstop is the most difficult position on the field besides catcher. So a move anywhere would improve Peralta's defense, in theory. In his limited time at third, Peralta has been at least average according to PMR and UZR.

There is no data on Peralta at second because he hasn't played there, but there is the Fan Scouting Report. Peralta's 2008 report says he has excellent arm strength, very good throwing accuracy, and almost average hands and release (with 50 being average in all categories). He also has poor ratings in instincts, first step, and speed. First step and speed are more important to a second baseman than arm strength and quick release, so we can probably rule out moving Peralta there. The combination of arm strength, accuracy, hands, and release are exactly what to look for in a third baseman. Instincts would arguably be nice as well, but the hot corner is as much about reaction as it is about instinct.

Wednesday, January 07, 2009

Cleveland Indians WAR Spreadsheet

Thanks to the hard-working Sky Kalkman over at Beyond the Boxscore, here's a spreadsheet of the Indians 2009 predicted Wins Above Replacement (WAR).


Some notes:
  • For hitting and pitching, I used the CHONE projections. On Sky's suggestion, I also used the quick-and-dirty formula (OBP*1.75 + SLG)/3 to approximate wOBA.

  • I included Luis Valbuena on offense to get closer to the "recommended" number of outs. As you can see, I'm still short. I'm not doing this as an endorsement of Valbuena over Barfield; CHONE has nearly identical plate appearances and wOBA for the two, making them interchangeable for the purposes of this exercise. I did leave out Andy Marte, since the popular assumption is that his time in Cleveland is short.

  • While my spreadsheet falls short of the recommended outs on offense, adding players (and therefore outs) actually increases offensive WAR in most cases. So, take this as a low-end projection.

  • Baserunning numbers are from Baseball Prospectus's EqBRR. I just used the 2008 numbers, so obviously there's room for improvement there.

  • For fielding, I used UZR from Fangraphs. I took a straight average of each player's UZR from 2006-2008 (when available). Obviously, a weighted average probably would have been better.

  • I also ignored position when taking UZR. This is mostly because I'm convinced the Indians will try some experimenting on the infield to get it right. But at the same time, I didn't want to guess how many innings each player would log at each position.

  • For the rotation, I started with the four known quantities - Lee, Carmona, Pavano (who will hopefully top that inning projection), and Reyes. Then I started filling in the best available players based on the CHONES until I got to the recommended inning count.

  • For the relievers, I followed the current Indians.com depth chart until I got to the recommended number of innings. But that doesn't necessarily mean I endorse that depth chart.


What does this all mean? If I filled in the spreadsheet correctly, the Indians project to a 90 win team. That's right on the cusp of the playoffs, which is exactly where the Indians want to be.

Wednesday, December 10, 2008

Cleveland Indians Sabermetrics 101: DIPS and RAR

In the last installment, we discovered that all pitchers' BABIP tend to fall in the .290 to .310. It follows then that if we want to gauge a pitcher's talent level, we need to look at everything besides balls hit into play. "Everything else" consists of strikeouts, walks, and homeruns, generally considered the "three true outcomes." There are a number of stats that study the three true outcomes, and together they are referred to as defense-independent pitching statistics - DIPS.

Before I go into examples of DIPS, I need to define a few terms.

replacement level: This is a popular concept among statheads. A replacement level player is one that is easily available as a mid-season free agent signing or a AAA call-up. Indians fans saw many replacement level players make starts for the Indians last year, Matt Ginter for example.

Runs Above Replacement, RAR: If "replacement level" is the amount of production you can get out of a player off the scrap heap, you would expect your regular players to be able to perform above that level. For pitchers, this means comparing the number of runs a pitcher gave up over a certain number of innings and comparing it to the number of runs a replacement player would have given up over the same number of innings. This is a tally of runs "saved" compared to a replacement pitcher, so a high positive number is better.

RAR for pitchers is calculated by taking the replacement level ERA, which is generally taken to be 5.75, subtracting the player's ERA, diving by 9 (since ERA is a measure of runs given up per 9 innings), and multiplied by innings pitched:

(5.75 - ERA) / 9 * IP

Wins Above Replacement, WAR: It's generally accepted in sabermetric circles that 10 runs is equal to 1 win. So, to find out how many Wins Above Replacement a pitcher earned, their RAR is divided by 10.

DIPS

Beyond the Box Score's article on this topic covers many pitcher stats. I'll let you look through those at your own leisure. The most advanced is a new stat called tERA. It takes the three true outcomes mentioned above, plus HBP and percentage of hits that were ground balls, line drives, infield flies, and outfield flies, plus takes the ballpark into factor. With input that complicated, it has to be accurate, right? Well, you and I can just take their word for it for the time being.

Since the goal for many sabermetricians is to take luck out of the equation, StatCorner - the same people that created tERA - also created xIP, expected Innings Pitched. Put simply, xIP tries to determine what each play "should have been" (ie, a screaming liner that was caught is changed to a hit, and a blooper that dropped is changed to an out) to give a more accurate look at the pitcher's workload.

Indians RAR/WAR in 2008

How did the Indians fare in 2008?
PitcherxIPtERARARWAR
Cliff Lee2222.64778
CC Sabathia122.673.26343
Fausto Carmona1214.64151
Zach Jackson573.81121
Aaron Laffey92.674.77101
Paul Byrd1285.4050
Jake Westbrook334.4050
Matt Ginter21.333.7650
Anthony Reyes324.7440
Scott Lewis234.5230
Jeremy Sowers1185.89-20
Bryan Bullington9.677.49-20
Tom Mastny1.6723.83-30
Total Result98279.13162.4516.24

As you can see, by this methodology Cliff Lee won eight games all by himself. Meanwhile, Matt Ginter, Bryan Bullington, and Tom Mastny were almost the definition of replacement level.

But that 162.45 total RAR means nothing without context. Cleveland finished fifth in the AL in RAR in 2008, just behind Boston and Tampa Bay, and just ahead of Anaheim and Minnesota. Toronto and the White Sox were almost 50 points ahead of their closest competitors, thanks to aces (Roy Halladay and Mark Buehrle) that scored in the 70s with a solid supporting staff. (Halladay and AJ Burnett are worth stars, but the rest of the Toronto rotation is very underrated.

Indians RAR/WAR in 2009

So, how do the Indians look in 2009? Will they need to add another starter?

The calculations for tERA and xIP are beyond my abilities at this point, so I cheated and used the innings pitched and ERA predictions from the 2009 Marcels. Here's what Marcel have to say for the guys currently on the 40 man roster.
PitcherIPERARARWAR
Cliff Lee1803.80394
Fausto Carmona1354.13242
Zach Jackson834.7291
Aaron Laffey1124.26192
Jake Westbrook934.16162
Anthony Reyes844.45121
Scott Lewis724.00141
Jeremy Sowers1274.82131
Total Result88634.34147.0314.7

Uh oh. That 147.03 RAR would be, by 2008 standards, ninth best in the AL. But there are a few things to remember. Marcel is admittedly a "dumb" system, and it looks at three years of data. That means it's taking Cliff Lee's disappointing 2007 and Fausto Carmona's nightmare 2006 into account. Also, RAR is dependent on innings pitched. So, once the Indians settle on their five best starters, and give them the innings that went to "experiments" last year, the numbers should improve.

Wednesday, December 03, 2008

Cleveland Indians Sabermetrics 101: BABIP

Inspired by this post at Beyond the Boxscore, here's my first "homework assignment" for Saber-Friendly Blogging 101.

Batting Average on Balls In Play, BABIP, is essentially batting average for everything except strikeouts and walks. I'll let the article above, Wikipedia, and the Sabermetric Wiki give you the details.

BABIP for hitters relies on many factors and will vary from player to player. But for pitchers, BABIP always seems to fall in the .290 to .310 range. What does this mean? If a pitcher is widely outside of that range one year, you can expect them to regress back to those numbers the following year, and their overall performance should follow. (I'm sure there are cases of certain pitchers having consistently high or low BABIP numbers, but I don't know of any offhand.)

So, how did Indians pitchers fare in 2008? To find out, you can check The Hardball Times or Fangraphs. Or, if you'd rather do the work yourself (or, like me, didn't find out about the THT and Fangraphs page until after doing the work), you need to start with their 2008 stats.

If you're not up to the task of setting up a MySQL database of baseball stats, you can simply copy and paste them from Baseball-Reference's 2008 Indians page into Excel. To determine At Bats, I took BFP (Batters Faced by Pitcher) minus Bases on Balls and Hit By Pitch. (I assumed IBB totals were already included in IBB.) I also ignored Sacrifice Flies because that information wasn't readily available. My results were almost identical to those from the Hardball Times. Fangraphs' were a little different, but as the Sabermetric Wiki mentions, there are several variations to the formula.

PlayerABBABIP ERA
Rich Rundles19.3851.80
Tom Mastny89.34410.80
Edward Mujica157.3286.75
Rafael Betancourt284.3115.07
Zach Jackson221.3105.60
Masahide Kobayashi229.3064.53
Rafael Perez288.3043.54
Cliff Lee852.3012.54
Jeremy Sowers491.3015.58
Jensen Lewis260.3003.82
Aaron Laffey369.2944.23
Fausto Carmona470.2945.44
Jake Westbrook131.2623.12
Anthony Reyes129.2591.83
Scott Lewis91.2222.63
Jonathan Meloan5.0000.00


I included At Bats in this table to illustrate a point: in general, as at bats increased, the pitcher's numbers moved more to the .290-.310 range. Rich Rundles and Jon Meloan only faced a handful of batters, so their numbers can largely be ignored. But you could almost argue the same for Scott Lewis and Tom Mastny.

Now, this table is good news for Tom Mastny and Ed Mujica, and even Rafael Betancourt and Zach Jackson to some extent. All posted high ERA and high BABIP. But their BABIP should go down in 2009, and their other stats should improve as a result. Conversely, Anthony Reyes and Scott Lewis will probably see their spectacular 2008 numbers fall back to earth. Jake Westbrook will probably see a decline as well, once he's finally healthy.

If BABIP holds true, that middle group should stay about the same. That's great news for Cliff Lee, Rafael Perez, and Jensen Lewis, as well as Aaron Laffey and Masahide Kobayashi to some extent. But it's also bad news for Jeremy Sowers and Fausto Carmona.

But BABIP is by no means a be-all, end-all predictor. For example, while Rafael Betancourt was on the edge of the expected BABIP range, his ERA was abnormally high (for him) due to a lingering injury that kept him from throwing his fastball, which is his best pitch. And while Cliff Lee was right in the middle in terms of BABIP, he'll still be hard-pressed to repeat the phenomenal year he had in 2008. Still, his BABIP numbers do show that 2008 wasn't entirely luck, and that Lee should still do very well in 2009.

Sunday, November 30, 2008

Cleveland Indians: Is Being Average An Improvement?

Recently, Walk Like a Sabermetrician took a look at 2008 hitting by position. They calculated runs created and runs created per game for each position, and used that to create a Runs Above Average metric that compares each player to the average production at their position.

My hypothesis has always been that you should want at least league-average production at every position - or at least a net of league average production.

So how did the Indians fare in 2008? Not too well. If you scroll down to the second to the last table in the Walk post, you see that the Indians were great at shortstop and center field, very good at catcher, and varying degrees of bad everywhere else. That's only three of nine positions above average, and a net of -11 runs above average.

The next step is to predict how the Indians will fare in 2009, to see what, if any, changes need to be made. I couldn't figure out how RAA was calculated. However, I did take the 2009 Marcels and calculated runs created and RC/27 for each of the Cleveland Indians key figures. Having that, I could compare that to the positional averages from the Walk article.

Now, I will admit there are two problems with my methodologies:
1) I'm using the generic RC/27, while "Walk" is using RC/G. RC/G uses the average number of outs per game (since the home team doesn't bat in the ninth when they're leading), which from what I could tell is normally around 25.5.
2) I'm comparing 2009 projections (from an admittedly simplistic projection model) to 2008 numbers, when ideally I should be comparing to several years worth of data.

That being said, here are Cleveland's RC/27 numbers for 2009, according to Marcel:
Choo6.63
Sizemore6.5
Hafner5.91
Martinez5.54
Shoppach5.36
Garko5.21
Francisco5.12
Peralta5.1
Cabrera4.76
Gutierrez4.48
Dellucci4.36
Carroll4.06
Barfield3.91
Marte3.7

Unfortunately, the Marcels don't include lefty/righty splits, but that would be a nice thing to look at in the future. Keeping that in mind, the best lineup by these numbers would have Kelly Shoppach catching; Victor Martinez at first; Asdrubal Cabrera, Jamey Carroll, and Jhonny Peralta in the infield (I'll leave the position argument for another article); Ben Francisco, Grady Sizemore, and Shin-Soo Choo in the outfield; and Travis Hafner at DH.

The 2009 projections give Cleveland four players above the league average for their position - Shoppach at catcher, Peralta at short, Sizemore in center, Choo in right, and Hafner at DH - with Cabrera around the league average at second and Martinez not too far behind the league average at first. (Or, if you prefer, you can call Peralta a league-average third baseman and Cabrera an above average shortstop.) You can increase that number to five if you count that Francisco's numbers are above-average for a center fielder and Sizemore's are still above average for a center fielder.

Fans of the Indians should see several nice things in these numbers: Martinez' ability to handle first without much of an offensive number, Cabrera's bat catching up to his glove, Peralta able to hit enough to be at least an average first baseman, and Hafner bouncing back to be productive again. Of course, these are just projections, but the offseason is always a time for optimism.

Now, back to the numbers. To recap, the Indians have five above-average positions (comparing Francisco to a center fielder), one average, one slightly below average, and one well below average. Working solely off these numbers, and thinking only about 2009, the wise choice would be to trade Kelly Shoppach for a league-average infielder. In that situation, Martinez would move back to catcher and Garko would enter the lineup at first base.

Thanks to Peralta and Cabrera's versatility, that infielder can be from any position, although a 5.1 RC/G third baseman would obviously be more productive than a 4.8 RC/G second baseman or 4.4 RC/G shortstop. The increased production from Carroll to the new infielder would more than compensate for the dropoff from Shoppach's 5.36 RC/27 to Garko's 5.21.

Of course, I am in no way suggesting a trade based solely on these findings. But what I am suggesting is that, by virtue of having more players at or above their position's averages in 2009, the Indians can look forward to a better season offensively.

Tuesday, November 25, 2008

Cleveland Indians: A Look at Baseball America's 2009 Top Prospect List

Baseball America recently released their Top 10 Cleveland Indians prospects for 2009. Along with the top 10 list is a list of the Indians best tools, and an always-fun look at what the Cleveland lineup may look like a few years in the future.

This year BA projected what the Indians may look like in 2012, and like their current prospect list their were some surprises.

The Prospects List

The biggest surprise to most, I'm sure, is that catcher Carlos Santana tops outfielder Matt LaPorta, who many thought to be one of the top prospects in any organization. LaPorta struggled with the Mendoza line in double A, the Olympics, and the Arizona Fall League, no doubt feeling the pressure of being "that guy from the CC Sabathia trade."

Meanwhile, Carlos Santana broke out at all levels this year. Indians fans lamented the journey of catcher Max Ramirez, who went from Atlanta to Cleveland for half a year of Bob Wickman in 2006, then to Texas for half a year of Kenny Lofton in 2007, then blossomed into a Major League-ready talent in 2008. Well, the Tribe got their payback when they traded half a year of Casey Blake for Santana, who now ranks just ahead of Ramirez in Project Prospect's latest Top 10 Catchers Under 25 ratings. Oh, and Santana is a full year and a half younger than Ramirez.

The article that accompanies Baseball America's Top 10 list correctly assesses Mark Shapiro when it comes to evaluating young talent. While Shapiro has come up short in the draft - often with questionable picks - he excels at acquiring minor league talent from other organizations, and complements that with free agent signings from Latin America. The list reflects that assessment, as Santana, LaPorta, and Michael Brantley find themselves among the Indians best prospects after starting this year in another organization. (Brantley was the player to be named later in the Sabathia trade.)

However, Shapiro is starting to show a knack for finding diamonds in the rough during the draft as well, as Cleveland's top three picks over the last three years - David Huff, Beau Mills, and Lonnie Chisenhall - find themselves at eigth, fifth, and sixth on the list. Mills, from a northwestern junior college, and Chisenhall, who until that point was most famous for getting kicked off of the University of South Carolina's squad for theft, were both considered overdrafts, but have flourished so far in the minors. Adam Miller and Canadian hero Nick Weglarz are also Shapiro draft picks.

This Year's List vs. Last Year's

Of the players who made both lists, Nick Weglarz was the biggest gainer, going from sixth in 2008 to third in 2009. Adam Miller and Beau Mills both fell, from first to fourth and third to fifth respectively. Miller's injuries notwithstanding, the two's new status is less a reflection of their own regression and more a reflection of the increased talent at the top of Cleveland's pool.

Chuck Lofgren and Jordan Brown fell off the list entirely from last year, and perhaps not surprisingly were left exposed in the upcoming Rule V draft. Lofgren especially deserves a second chance, as his poor 2008 was a result of injuries and his mother's battle with cancer.

Wes Hodges also fell from the list from his number four spot, but he continues to be Cleveland's projected third baseman, for at least 2010 and 2011. (For more on the 2012 lineup, keep reading.) David Huff stays the same at number eight. Aaron Laffey, Ben Francisco, and Jenson Lewis, meanwhile, all "graduated" from their prospect status in 2008.

Best Tools

I didn't get to see any of these prospects in action in 2008, so I'm not in a position to agree or disagree with anything BA said. However, there are some promising signs to point out.

Michael Brantley has immediately become the team's best hitter for average and best athlete. That's great for someone who's expected to be the team's leadoff hitter of the future. That's especially great on a team that's been starved for athleticism as of late. Matt LaPorta, predictably, is the team's best power hitting prospect. Finally, it's nice to see that despite all his struggles, Adam Miller is still considered to have the best fastball and slider in the organization.

Cleveland Indians Projected 2012 Lineup

Indians fans will notice quite a few exceptions from 2008 on this list: Victor Martinez, Kelly Shoppach, Ryan Garko, Asdrubal Cabrera, Franklin Gutierrez, Ben Francisco, and Aaron Laffey stood out for me.

Garko, Gutierrez, Francisco, and Laffey, while decent, are also easily replaceable. Victor Martinez's current contract is up before 2012, and Baseball America surely took that (and Victor's age) into account.

But what about Shoppach and Cabrera? The Indians recently added Carlos Santana and Chris Gimenez to their 40-man roster, who along with Martinez, Shoppach, and Wyatt Toregas give the club five catchers. Some say that is a clear sign the Indians will use Shoppach as trade bait to fill in a key need this offseason.

Cabrera is the mystery, though. For the past several months, I've campaigned to move Jhonny Peralta to second base, both because his defense isn't good enough for short and his offense isn't good enough for third. I was just about to give up (hey, we can move him to third and sign a good offensive second baseman to make up for it) when Baseball America sparked the debate again. That leaves the shortstop position open to Cabrera and Carlos Rivero. I don't know much about Rivero, but I'll take the experts' word on him for now. After all, it is just harmless speculation.