For many years, sabermetricians ignored fielding, at least partially because it was so much harder to quantify compared to hitting.
The original fielding metric is fielding percentage, (outs + assists)/(outs + assists + errors). That was fine in the 1800s, when it's been argued that players weren't expected to catch anything that wasn't hit right at them. To this day, errors are still subject to the opinion of the official scorer, as witnessed recently by CC Sabathia's lost no hitter on a bunt single and Orlando Cabrera's in-game call to the press box to have an error changed to a hit.
So errors and fielding percentage are probably not the best way to judge a fielder. Then, what is? Arguably, there are two ways to do so: noting whether a fielder got to a ball (or whether they should have), and whether they actually fielded it once they got there. (Throwing ability - accuracy and strength - are another issue, but we won't go into that today.) Brian Cartwright wrote an excellent piece for Fangraphs the other day, explaining why fielders with poor range are better at actually fielding the ball, and vice-versa.
Other Fielding Statistics
As mentioned above, sabermetricians avoided fielding for a long time because it was difficult to quantify. Now, a variety of fielding measures exist, and still we have none that stands head and shoulders above the rest. Here are just a few metrics that exist today.- Range Factor: Bill James' first crack at a fielding statistic, Range Factor is the number of plays a fielder makes per nine innings. In other words, it's basically the fielding equivalent of ERA. Of course, like ERA the system has its drawbacks. For example, the type of pitcher (flyball vs. ground ball) will affect the number of chances a fielder has in a game.
- Zone Rating: STATS Inc. divided the field into zones and calculates Zone Rating as the number of outs made in a fielder's designated zones divided by the total number of balls hit into that zone.
- John Dewan's Plus/Minus: Like many of these fielding stats, Plus/Minus involves watching video of every single play over the course of a season and charting whether a fielder should have made the play. In this case, Baseball Info Solutions (BIS) assigns a "plus" for every play made that someone else at that position didn't make, and a "minus" for every play not made that someone else at that position made.
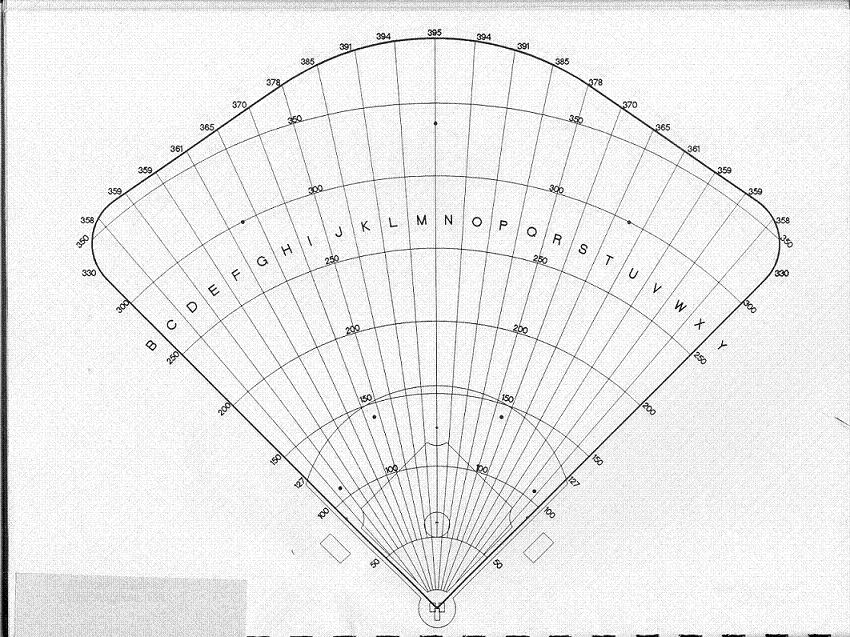
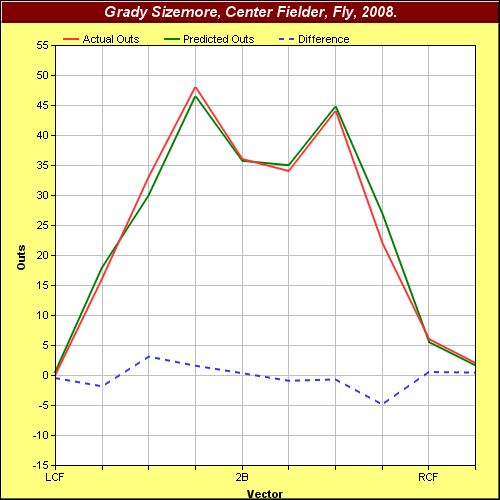
- Probabilistic Model of Range: Created by Dave Pinto, a former ESPN and STATS, Inc. statistician, PMR is another way of comparing a fielder's performance relative to his peers. PMR views the field as a right angle, and breaks fielding down by angle relative to the foul lines. That information can be used to create graphs like this one, which shows that in 2008, Grady Sizemore was slightly above average (compared to other center fielders) on fly balls hit to his right, but slightly below average on flies to his left.
- Ultimate Zone Rating: A continuation of Zone Rating, Mitchel Lichtman's UZR is actually calculated two ways: using BIS's data and using STATS Inc.'s data. Here is a comparison of the two UZR ratings and PMR.
- Fan Scouting Report: For those of you that don't like math at all (except for counting), this is the stat for you. Tangotiger's Fan Scouting Report is a crowdsourced scouting report that ranks fielders in terms of instincts, first step, speed, hands, release, arm strength, and throwing accuracy.
- : If the Fan Scouting Report is perfect for those who don't like math, than Colin Wyers' graphs are perfoect for those who don't even like words. Colin simply took the location of every fielded ball and plotted it on a graph, with a baseball field laid as the backround. Here's a comparison of Troy Tulowitzki and Derek Jeter's 2007 fielding.
The Next Steps
Fielding statistics still have many unsolved questions, but two of the main issues are determining a fielder's starting position, and determining teammates' influence on fielding statistics.The comments of this thread have a discussion of fielders' starting position. As the charting and video coverage of games improve (PitchF/X, HitF/X, and the work BIS and STATS do), this area will improve as well. Of course, starting position needs to be taken in context. If a fielder is always standing in the right place at the right time, they certainly should get credit for knowing where to stand (or at least his coaches should get credit). But standing in the right place means he won't have as far to run to get to a ball, and therefore it will seem as if he doesn't have much range. So statisticians will have to be careful not to punish him for that.
Another issue is the affect teammates have on each other. For example, on a ball hit between the first and second baseman, the first baseman has the first attempt at the ball because he's positioned closer to first base. A second baseman would only have a chance at the ball if the first baseman couldn't get to it.
Take a look at the PMR ground ball charts for Ryan Howard, Chase Utley, Albert Pujols, and Aaron Miles. At first it looks like Miles is below average at ground balls towards first base. But perhaps that is because Pujols is getting to many of the balls that normally would have gone through to his second baseman. Likewise, Chase Utley appears to be great at getting ground balls towards first base, but only because Ryan Howard is below average at fielding balls in that direction. Trade Utley for Miles (a move the Phillies surely would never make), and you would probably see Utley's PMR decline and Miles' improve.
Of course, PMR also does not indicate starting position. Knowing that Howard isn't a great fielder, maybe Utley positions himself a little closer to first base to make up for it. And maybe Miles positions himself a little farther from second base to account for Pujols' range. But if that was the case, you would expect Utley to have below-average performance on balls hit towards second base, and Miles to have above-average performance. In reality, the graphs show that Utley is above average in both directions, while Miles is only average on balls hit towards second base. So, Utley had a phenomenal 2008 in the field, a fact corroborated by his unheard of +47 rating in John Dewan's Plus/Minus system.
The Jhonny Peralta Problem
One of the big questions for Cleveland Indians fans is Jhonny Peralta's defense. Most fans want him to move to third base, but in the past I have suggested a move to second base.How does Peralta rate as a shortstop? According to PMR (2006, 2007, 2008), he's actually around average on grounders, and maybe even a little above average on fly balls and liners. But UZR gives him a negative rating for every year after his rookie season.
Working on the assumption that he's a below-average shortstop (even if that disagrees with PMR), where should he move? As per this discussion, shortstop is the most difficult position on the field besides catcher. So a move anywhere would improve Peralta's defense, in theory. In his limited time at third, Peralta has been at least average according to PMR and UZR.
There is no data on Peralta at second because he hasn't played there, but there is the Fan Scouting Report. Peralta's 2008 report says he has excellent arm strength, very good throwing accuracy, and almost average hands and release (with 50 being average in all categories). He also has poor ratings in instincts, first step, and speed. First step and speed are more important to a second baseman than arm strength and quick release, so we can probably rule out moving Peralta there. The combination of arm strength, accuracy, hands, and release are exactly what to look for in a third baseman. Instincts would arguably be nice as well, but the hot corner is as much about reaction as it is about instinct.